Our poster entitled Exploring Large Language Model (LLM) for TNM Categorizing and Re-categorizing Nasopharyngeal Carcinoma (NPC) from Structured Text Reports available at the end of this page.
In my final year as a PhD student, I worked on something quite interesting: using the power of deep learning to predict knee joint T1rho images with incomplete physical information. To those familiar with deep learning, this might not seem like a big deal—after all, deep learning can generate lifelike images from a patch of noise. But to people in the magnetic resonance imaging (MRI) field, might don’t agree: it’s almost like throwing away MRI physics and using purely statistical experience to create images that appear physically meaningful. From my observations at the ISMRM annual meetings over the past few years, it seems the community has taken a considerable amount of time to accept this type of work.
We gave this work a very long title: Utilizing 3D fast spin echo anatomical imaging to reduce the number of contrast preparations in T1rho quantification of knee cartilage using learning-based methods. This work was led by me as the first author, with my PhD supervisor Professor Weitian Chen as the corresponding author; my fellow group member Chaoxing Huang was a major contributor.
This work was submitted to the top journal in the MRI community, Magnetic Resonance in Medicine, in February 2025, accepted in July of the same year, and officially published online a few days ago. If you don’t want to read my ramblings, you can click “Read more” at the end of the article to go directly to the paper. Thanks to the sponsorship of the university library, this paper is now Open Access, so everyone can view and download it freely here.
Background
The background of this work originates from my PhD supervisor Professor Weitian Chen’s early career experience in the industry—they hoped to achieve simultaneous high-resolution knee anatomical and T1rho imaging through a 3D fast spin echo sequence (3D FSE/TSE). This goal, it can be said, has not yet been fully realized even at the time of this paper’s publication. The main challenge is that T1rho imaging typically requires acquiring multiple (usually 4) spin-lock prepared images, which are then used to fit a signal model. One T1rho imaging method recommended by the RSNA, 3D MAPSS based on gradient echo imaging (GRE), can complete a T1rho acquisition in 5-12 minutes [1]. Although this is not slow, we believe there is still an issue: T1rho itself is an additional knee acquisition sequence. It doesn’t do anything more on its own and is an extra time burden for the entire knee scan. In contrast, the 3D FSE-based T1rho acquisition method our group has been developing long-term has image features similar to proton density (PD) at a time of spin-lock (TSL) of 0, which is similar to the clinically acquired PD-w FSE images.
Besides the sequence-related reasons, we also developed and observed the gradual maturation of deep learning-based acceleration methods for T1rho and other quantitative MRI. These acceleration methods not only include conventional k-space-based methods, such as MANTIS [2], but also many methods that fit the signal model using fewer acquired images, such as the work by this paper’s main contributor, Chaoxing Huang, on liver T1rho [3,4,5]. Based on Chaoxing’s work, we wondered if we could, based on the image similarity caused by the sequences mentioned above, replace the TSL=0 T1rho image with a PD-w image and feed it into a neural network along with a T1rho image with a non-zero TSL to predict the final T1rho quantification.
Implementation
Data
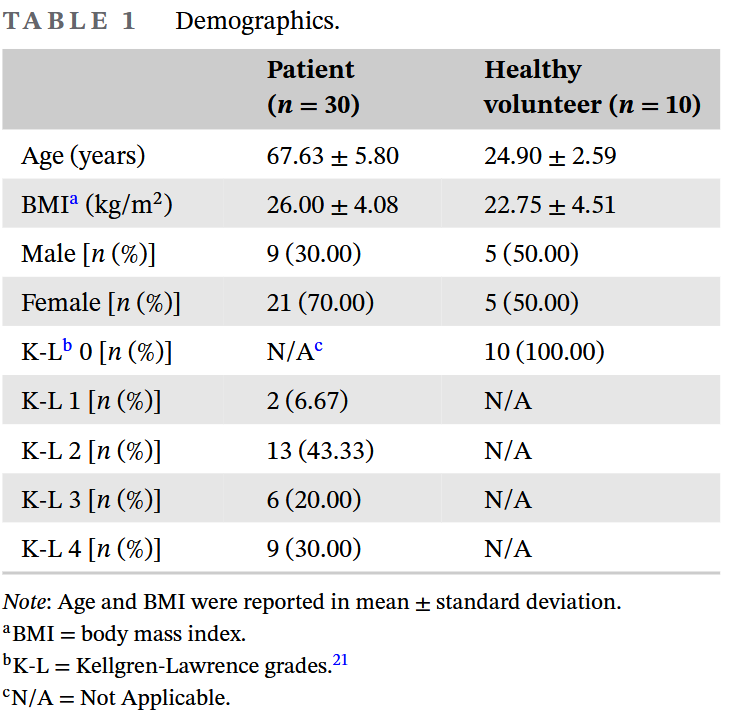
We dug out images from 30 knee osteoarthritis patients and 10 volunteers from previous projects. Because knee osteoarthritis is common in the elderly, and the volunteers were friends from around the lab, we can see that the age and BMI gaps between the two groups are quite large. At the same time, this batch of data had a majority of late-stage OA patients, and many also had cartilage perforations. But in the end, because the amount of data was too small, we had to mix all the images from the 40 participants together for use.
MRI Pulse Sequence Design
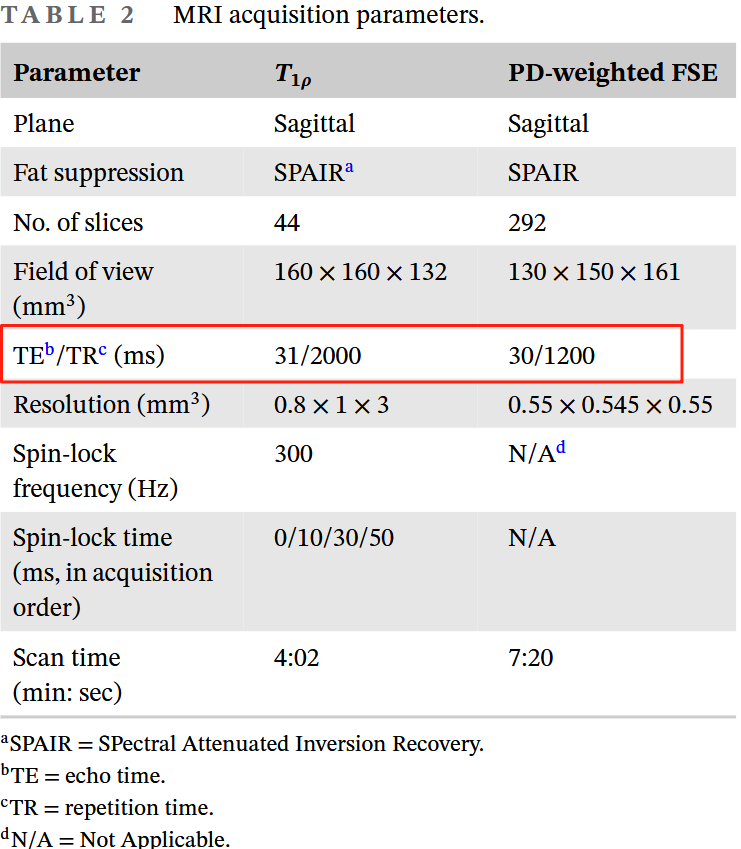
In terms of sequence design, we used the most standard 3D FSE T1rho implementation [6] and a conventional 3D FSE sequence. The image readouts for both sequences used Philips’ commercial implementation (VISTA™). The sequence parameter table above provides the TE/TR parameters for the two sequences; you can see that both are PD-weighted with a short TE and long TR. Since I’m not a sequence expert, I won’t try to show off here. For specific sequence implementation details, you can refer to the original paper and reference [6].
Image Preprocessing
Before moving on to deep learning, we also needed to perform a series of image preprocessing steps. Looking at the MRI parameters above, it’s not hard to see that these two sequences were not acquired from the same FOV (it was old data). Therefore, we first registered the two images from the same person, transforming the high-resolution PD-w FSE image to match the relatively lower-resolution T1rho image. We used the handy ANTsPy toolkit, employing a three-stage registration: rigid -> affine -> deformable (SyN, [7]), to ensure the cartilage regions were aligned as much as possible. After registration, we confirmed that the Structural Similarity Index (SSIM) within the cartilage regions reached a high level of 0.97 ± 0.01 (mean ± standard deviation). The specific registration process can be found in the supplementary material S1 of the original paper.
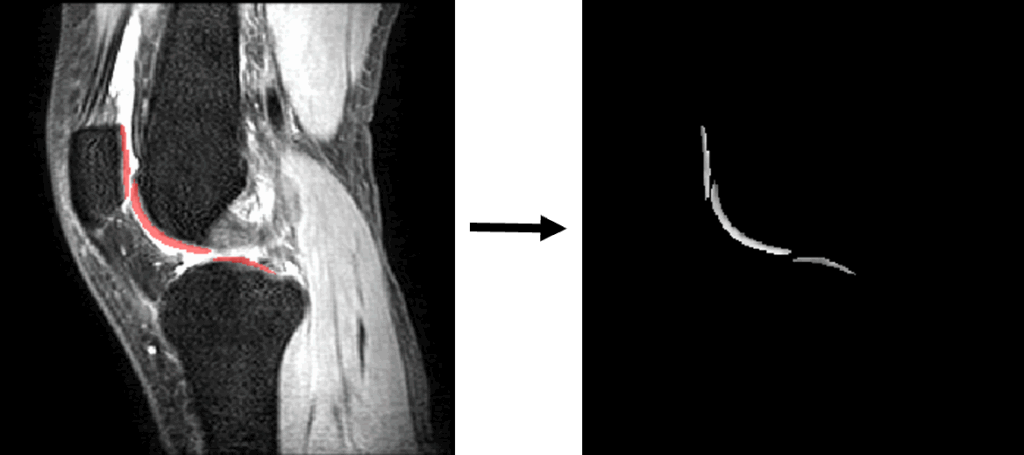
We had previously prepared segmentation labels for four cartilage regions (femoral, medial and lateral tibial, and patellar cartilage) on the T1rho images of this dataset. In the experiments and analysis of the main text, we will merge these four cartilage regions into a single complete cartilage region for statistical calculations. As for the metrics for the four individual cartilage regions, due to the large amount of data, we provide them in the supplementary material S3 of the original paper.
After registration, we split the 3D images into 2D slices or 1D vectors according to the experimental design. One set of 2D slices would also be masked, while the 1D vectors would only contain the pixel values within the cartilage regions. During the splitting process, we retained the relevant positional information to restore the T1rho values predicted by the neural network to their corresponding 3D spatial positions for visualization and calculation of experimental metrics.
Neural Network Design
2D U-Net1D MLP
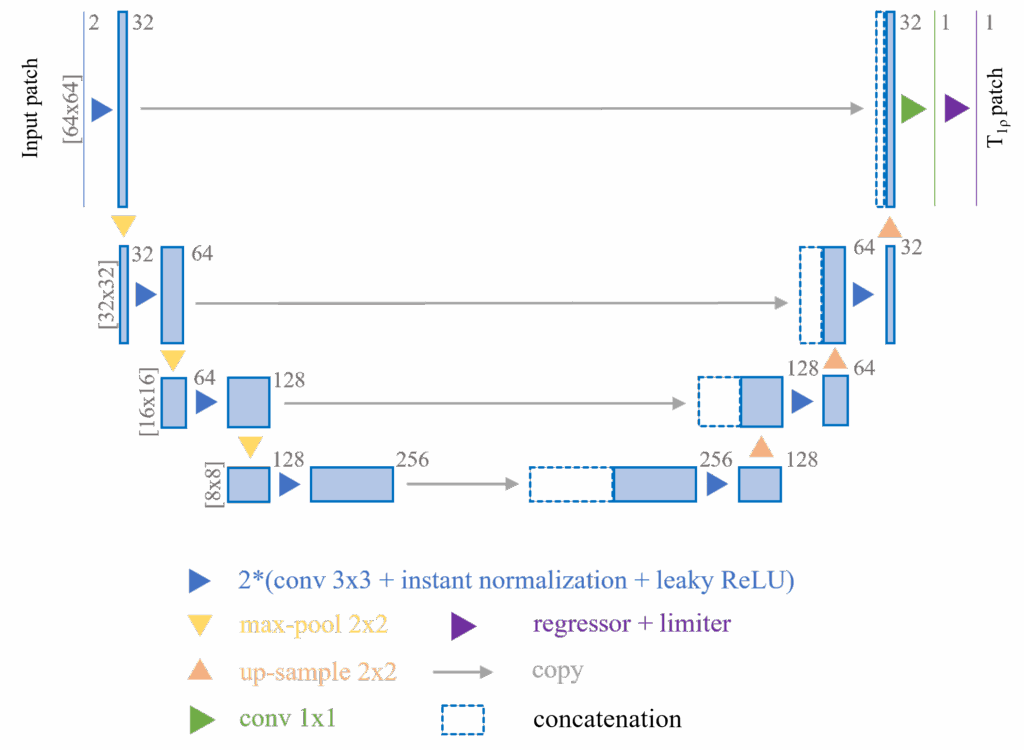
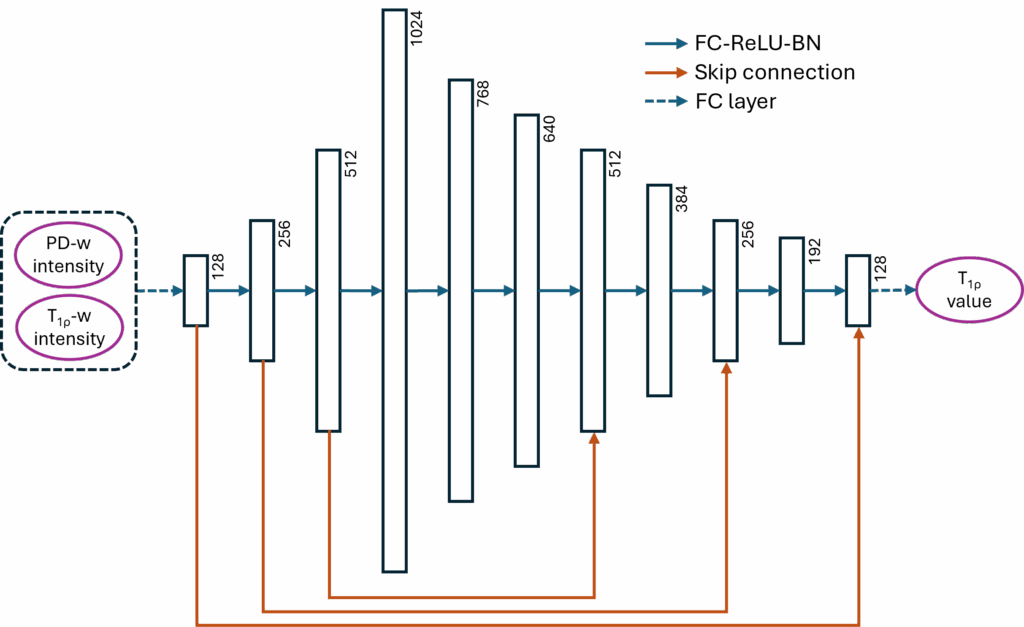
From the very beginning of the project, we didn’t intend to create a very complex neural network design. There are two reasons: first, our audience is mainly scholars in the MRI community, who may not be familiar with or approve of the advanced neural network models in the deep learning community today; second, we believe that the simpler the neural network design, the more it demonstrates the universality of our hypothesis. So in this paper, we only introduced two very simple but time-tested neural network designs: a U-Net [8] with a replaced regressor and a multi-layer perceptron (MLP, modified from [9]) with skip-connections, using 2D and 1D data respectively.
We introduced two simple tricks to the 2D U-Net to improve the model’s stability:
Before the data is input into the model, we crop small patches of 64 × 64 pixels at random locations around the cartilage region from the original 256 × 256 pixel images. These patches then undergo multiple transformations for data augmentation. This process introduces randomness into the training data and greatly expands the actual amount of usable data, thereby improving the model’s stability and performance.
At the end of the 2D U-Net, before the final output, we introduced a clipper. This clipper removes unreasonable T1rho value predictions (i.e., less than 10 or greater than 100) and the corresponding gradient information for those predictions. This clipper helps the model converge quickly by introducing external experience, thus improving the model’s stability and performance.
Other design details of the neural networks include:
Both models use the L1 loss function, i.e., Mean Absolute Error (MAE).
Both models were trained for 1000 epochs.
The 2D U-Net used the Adam optimizer with an initial learning rate of 0.001 and a weight decay of 0.0003; the learning rate was multiplied by 0.9 after each epoch for exponential decay.
The 1D MLP used the RMSProp optimizer, also with an initial learning rate of 0.001 and a weight decay of 0.0003.
Evaluation Metrics
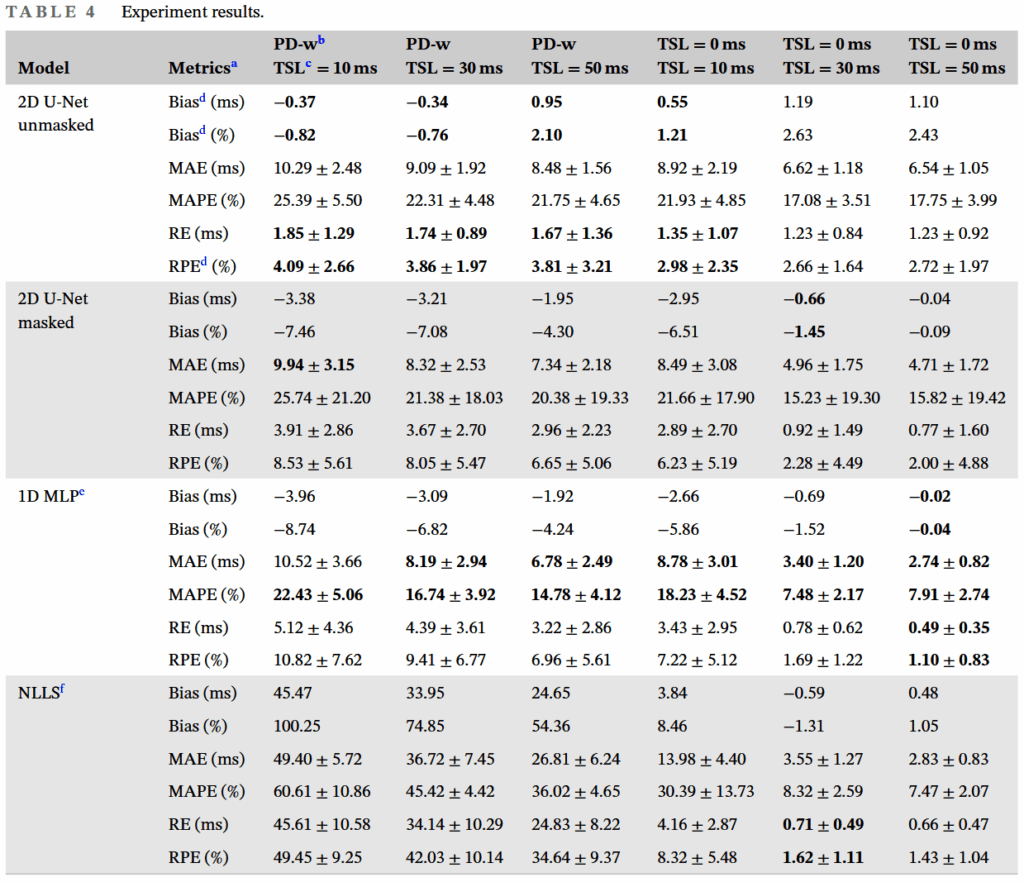
We mainly use bias, Mean Absolute Error (MAE), Mean Absolute Percentage Error (MAPE), Regional Error (RE), and Regional Percentage Error (RPE) to evaluate the T1rho values predicted by the neural network. These metrics are all calculated within the entire cartilage region of each knee image, and the mean ± standard deviation of the 40 images are reported.
Considering that T1rho and similar quantitative MRI techniques are often used with average quantification within a region of interest (ROI), we primarily use RPE as the evaluation standard, with a main target of RPE less than 5%.
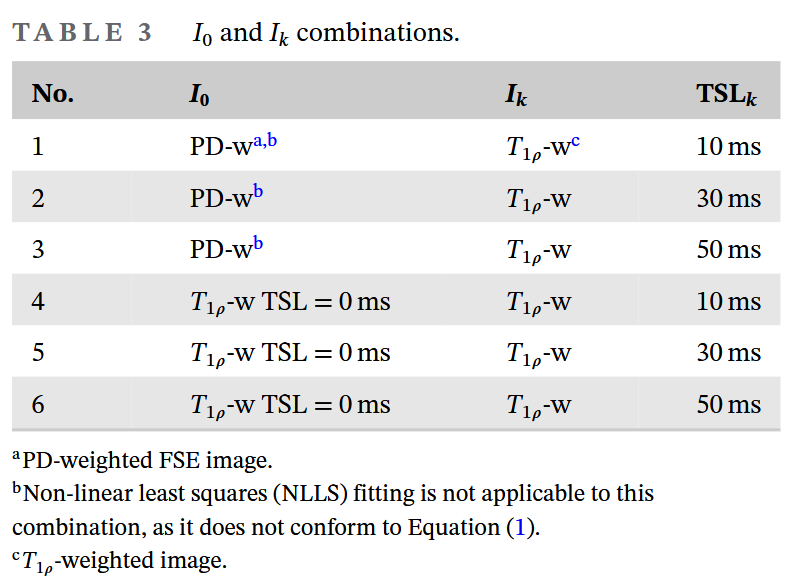
The reference T1rho values used for calculating these metrics and training the neural networks were obtained by fitting the signal model from 4 T1rho images using the traditional non-linear least squares (NLLS) method. It should be noted that we cannot obtain the true ground truth values of T1rho.
Experimental Design and Results
In our experimental design, we aimed to answer the following three questions:
How do different combinations of the two input images to the neural network affect the model’s performance?
How do the two neural network models perform under the same image combination?
When using the 2D U-Net, does masking pixels outside the cartilage region improve the model’s performance?
To address these three questions, we designed three experiments. These experiments use different data and model combinations to try to integrate the relevant results and answer the questions one by one. Due to limited space, I will only cite the relevant experimental data in the results section below. For the complete results, please refer to the original paper.
Full result table
Experiment 1: Input Data
As shown in the table above, we have a total of 6 input data combinations, corresponding to the PD-w and TSL=0 T1rho images, and 3 T1rho images with non-zero TSLs. In this experiment, to exclude the influence of the model on the results, we only compare the results from the model with the lowest RPE (best performance) for each input data combination.
From this experiment, three results are evident:
Replacing one of the data points from a T1rho image to a PD-w image does significantly affect the neural network’s performance.
Even when one data point is a PD-w image, i.e., the 3rd, 4th, and 5th columns in Table 4 of the original paper, the neural network method can still achieve good T1rho prediction performance.
As the non-zero TSL data point is replaced with data having a longer TSL, it can be seen that all evaluation metrics improve.
Experiment 2: Neural Network
The two neural network models showed distinctly different performances with different data combinations. We found that for four of the six data combinations, the best model was the 2D U-Net, while for the remaining two, it was the 1D MLP.
Observing these data combinations, it’s not hard to see that three of them involved PD-w images, and the remaining one involved a T1rho image with TSL = 10ms. Since the “optimal” TSL is close to the mean T1rho value [10], and the mean T1rho in our data is approximately 45.38ms, we can consider data combination 6, i.e., two T1rho images (TSL = 0/50ms), to be the closest to the signal model. Thus, we can interpret the above phenomenon as: when more out-of-distribution (OOD) data is introduced, the performance of the 2D U-Net surpasses that of the 1D MLP, and vice versa.
Experiment 3: Masking Cartilage ROI for 2D U-Net
Whether or not non-cartilage regions are masked also affects the 2D U-Net model’s performance in relation to the input data.
We observed that for four of the six data combinations, the performance without masking was better than with masking, while the opposite was true for the remaining two. And this 4+2 combination is completely consistent with the neural network model comparison in Experiment 2 above. Therefore, we can draw a similar conclusion—masking non-cartilage regions for the 2D U-Net can effectively improve model performance in non-OOD data situations, and vice versa.
Discussion & Conclusion
From the results of the three experiments above, we can easily draw the following conclusions:
It is feasible to replace the TSL = 0 T1rho image with a PD-w image and then use a neural network for T1rho prediction.
Our experiments verified that both the 2D U-Net and the 1D MLP attempt to fit the T1rho signal model, which is consistent with the theory of neural networks as universal approximators. However, if the neural network is required to highly fit a specific signal model, it is necessary to reduce OOD training data and noise.
The 2D U-Net is better able to utilize image information such as morphology and edges from MRI images to optimize T1rho prediction performance under OOD data conditions.
At the same time, we must also point out the limitations of this work:
Our dataset is too small and its distribution is not ideal. Despite using five-fold cross-validation, 40 data points are still a huge challenge. With this amount of data, we cannot make any guarantees about the model’s transferability.
All 40 data sets came from the same location and the same MRI scanner, lacking multi-center, multi-vendor validation.
It still requires scanning one T1rho image to complete the prediction.
We designed such a deep learning/neural network-based method with the initial hope of using the model to mine potential implicit physical information within MRI images, and ultimately to promote the clinical application of new MRI technologies. This implicit physical information may be difficult to express with a clear model. Therefore, in this context, methods based on statistics and learning, such as deep learning, have their unique charm. Based on this line of thinking, we might be able to further extend our method to other quantitative MRI techniques, such as T2, or to deduce T1rho information from T2 information. Assuming the relevant algorithms are actively implemented, we might see the widespread popularization of quantitative imaging throughout the entire process of arthritis patient management in the near future.
Due to limited space, I have omitted many detailed steps and discussions. If you are interested, please proceed to read the paper.
References
Chalian M, Li X, Guermazi A, et al. The QIBA Profile for MRI-based Compositional Imaging of Knee Cartilage. Radiology. 2021;301(2):423-432. doi:10.1148/radiol.2021204587
Liu F, Feng L, Kijowski R. MANTIS: Model-Augmented Neural neTwork with Incoherent k-space Sampling for efficient MR parameter mapping. Magnetic Resonance in Medicine. 2019;82(1):174-188. doi:10.1002/mrm.27707
Huang C, Wong VWS, Chan Q, Chu WCW, Chen W. An uncertainty aided framework for learning based liver T1ρ mapping and analysis. Phys Med Biol. 2023;68(21):215019. doi:10.1088/1361-6560/ad027e
Huang C, Qian Y, Yu SCH, et al. Uncertainty-aware self-supervised neural network for liver T1ρ mapping with relaxation constraint. Phys Med Biol. 2022;67(22):225019. doi:10.1088/1361-6560/ac9e3e
Huang C, Qian Y, Hou J, et al. Breathing Freely: Self-supervised Liver T1rho Mapping from A Single T1rho-weighted Image. In: Proceedings of The 5th International Conference on Medical Imaging with Deep Learning. ; 2022. Accessed July 15, 2024. https://proceedings.mlr.press/v172/huang22a.html
Chen W, Chan Q, Wáng YXJ. Breath-hold black blood quantitative T1rho imaging of liver using single shot fast spin echo acquisition. Quantitative Imaging in Medicine and Surgery. 2016;6(2):16877-16177. doi:10.21037/qims.2016.04.05
Avants BB, Epstein CL, Grossman M, Gee JC. Symmetric diffeomorphic image registration with cross-correlation: Evaluating automated labeling of elderly and neurodegenerative brain. Medical Image Analysis. 2008;12(1):26-41. doi:10.1016/j.media.2007.06.004
Ronneberger O, Fischer P, Brox T. U-Net: Convolutional Networks for Biomedical Image Segmentation. Medical Image Computing and Computer-Assisted Intervention, Pt Iii. 2015;9351:234-241. doi:10.1007/978-3-319-24574-4_28
Zhang X, Duchemin Q, Liu* K, et al. Cramér–Rao bound-informed training of neural networks for quantitative MRI. Magnetic Resonance in Medicine. 2022;88(1):436-448. doi:10.1002/mrm.29206
Zibetti MVW, Sharafi A, Regatte RR. Optimization of spin-lock times in T1ρ mapping of knee cartilage: Cramér-Rao bounds versus matched sampling-fitting. Magnetic Resonance in Medicine. 2022;87(3):1418-1434. doi:10.1002/mrm.29063
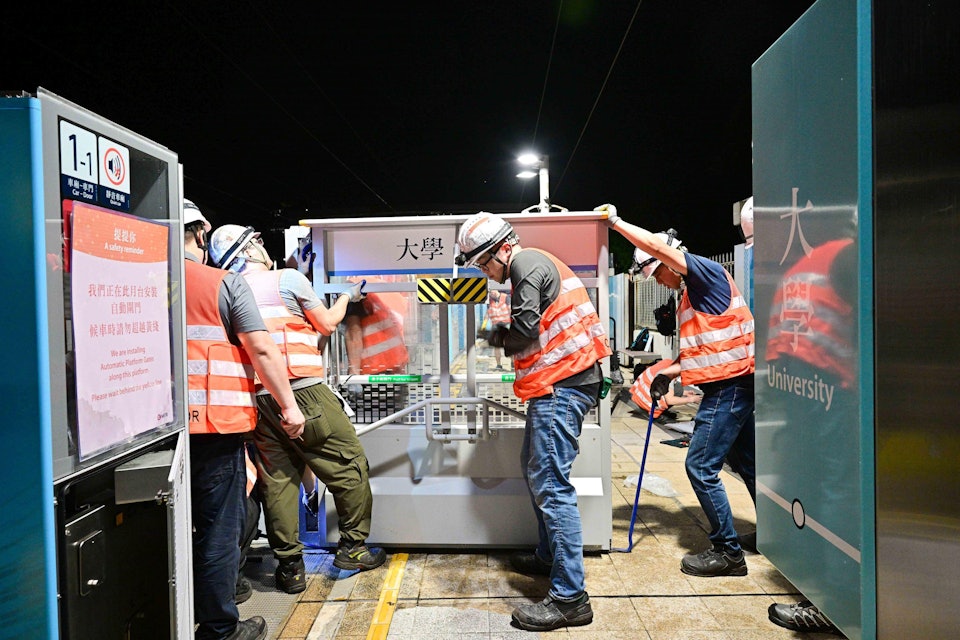
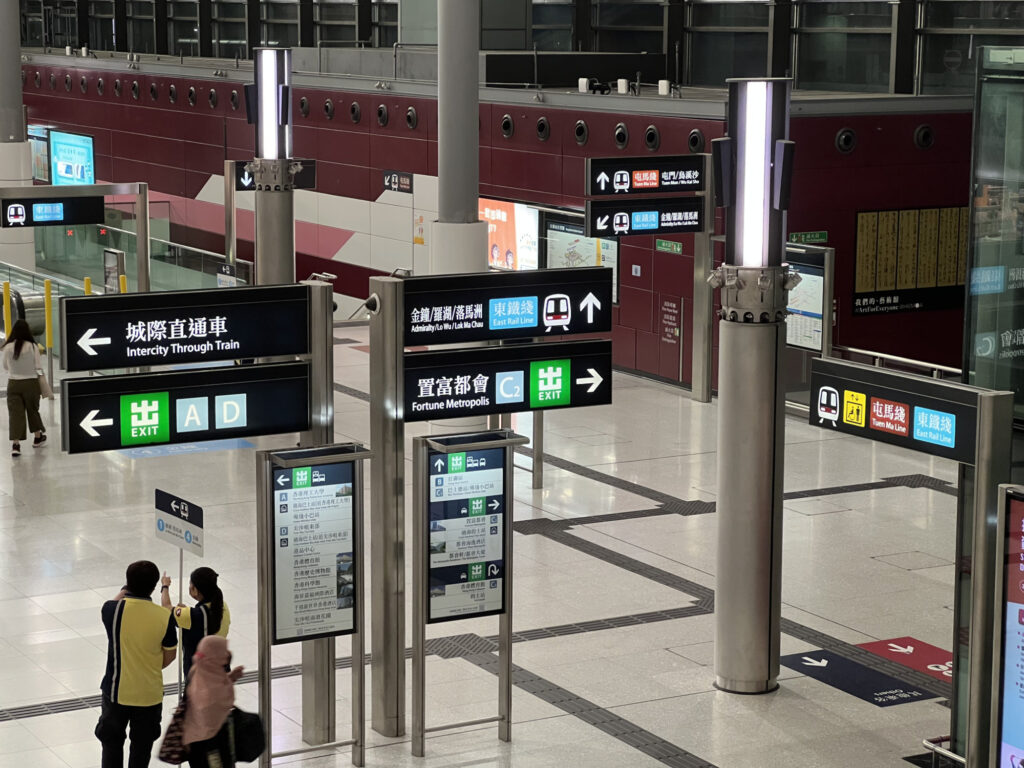
On May 11, 2025, the installation of the last platform screen door at University Station was completed, with the remaining platform screen door construction also set to be fully completed in May-June 2025. This marks the conclusion of the long-delayed “Railway 2.0” and Sha Tin to Central Link (SCL) project (the official name for the Tuen Ma Line and East Rail Line cross-harbour section, referring to the “Sha Tin to Central Link”).
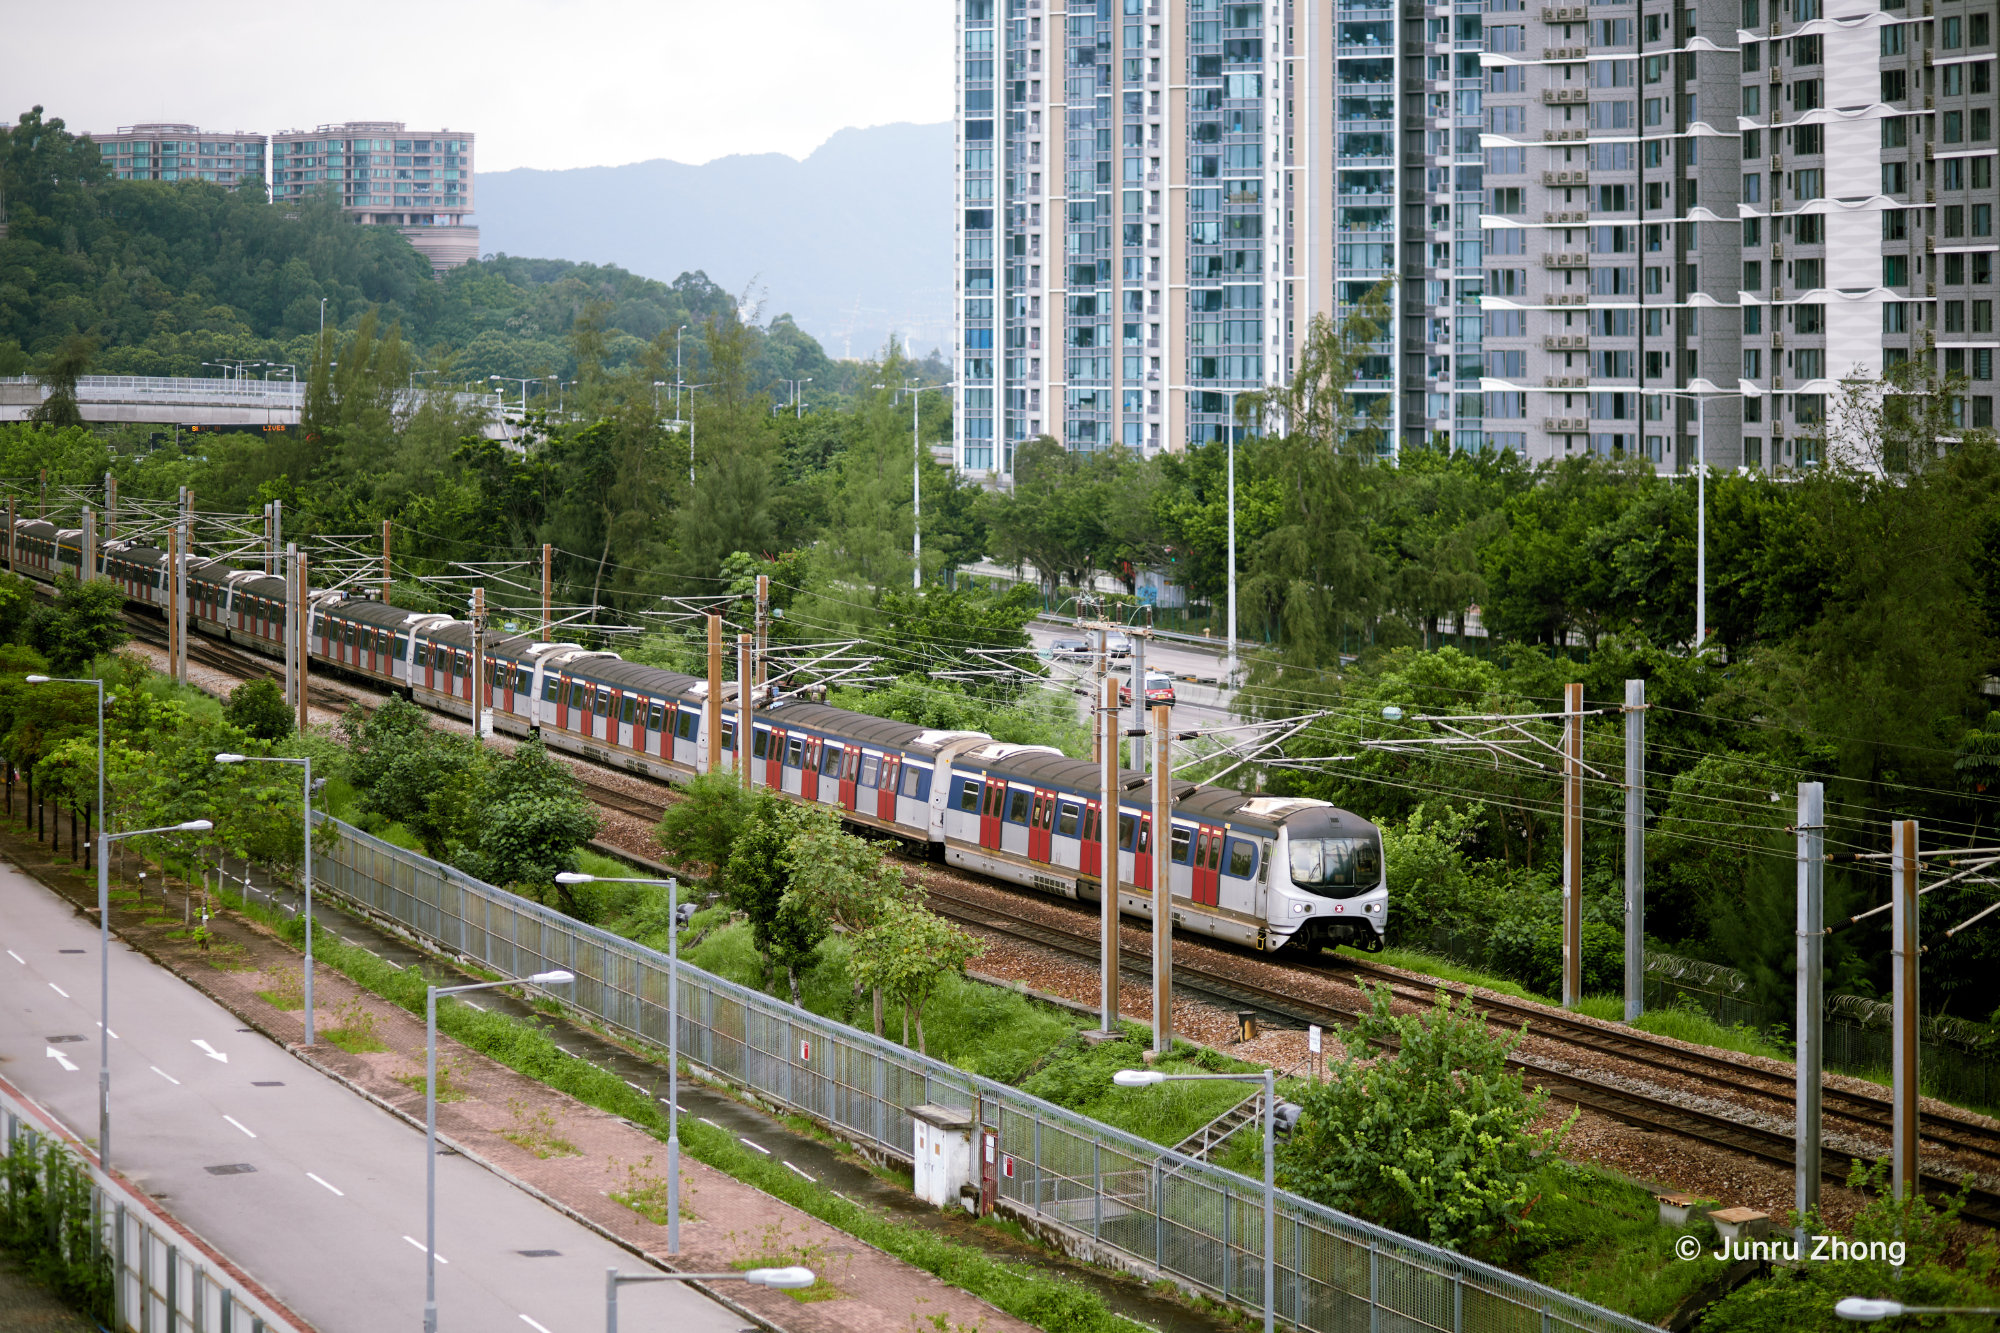
Due to the construction of the SCL, the Hong Kong railway system experienced many significant events during 2020-2022. I have been living in the Sha Tin district for these years, and being in close proximity, I had the fortune to witness and personally participate in many of these events. Recently, coinciding with the 3rd anniversary of the East Rail Line’s cross-harbour section opening, as well as the 3rd anniversary of the MLR trains’ retirement and the 43rd anniversary of the “Yellow-headed” trains’ service, I have organized the relevant photos I have on hand to share my memories of this railway line over these years.
I miss the braised chicken legs from the through train
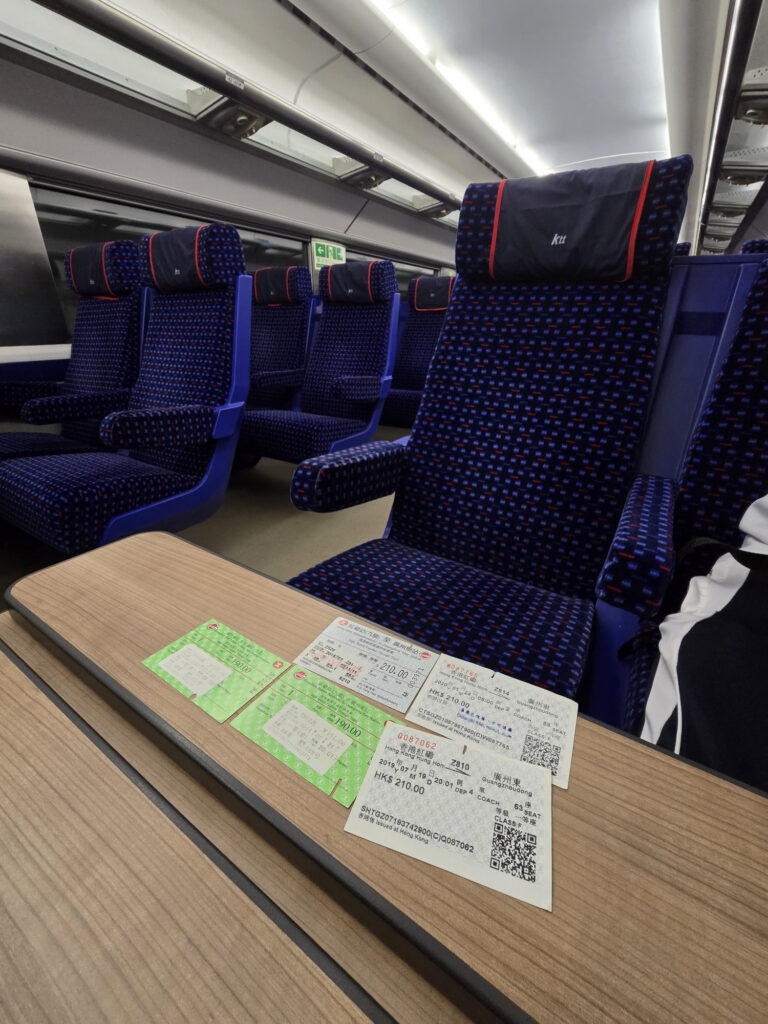
In 2019, I took the through train multiple times between Hong Kong’s Hung Hom Station and Guangzhou East Station, traveling on both Guangzhou Railway (CR) and Hong Kong MTR trains. On January 24, 2020 (Chinese New Year’s Eve), I took the early KTT train back to Guangzhou, thinking I would return to Hong Kong after the holiday to continue my student life. No one could have imagined that the COVID-19 pandemic would so quickly and decisively interrupt normal life. The through train service was also suspended a few days later, until 2024 when the final decision was made to permanently cancel it.
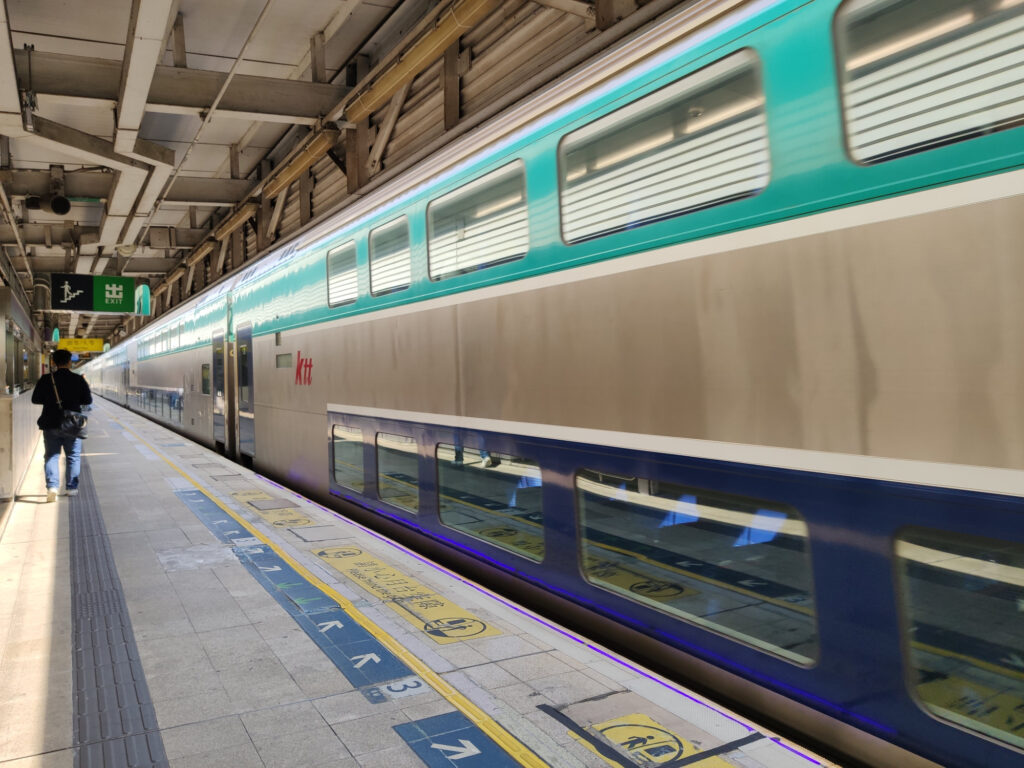
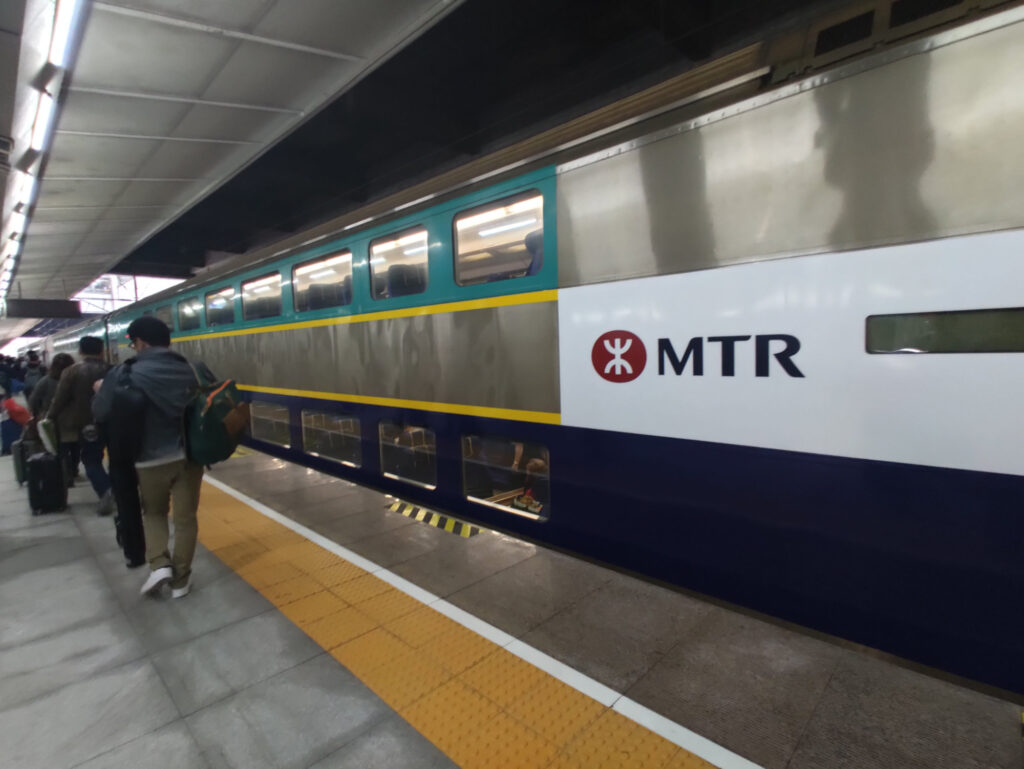
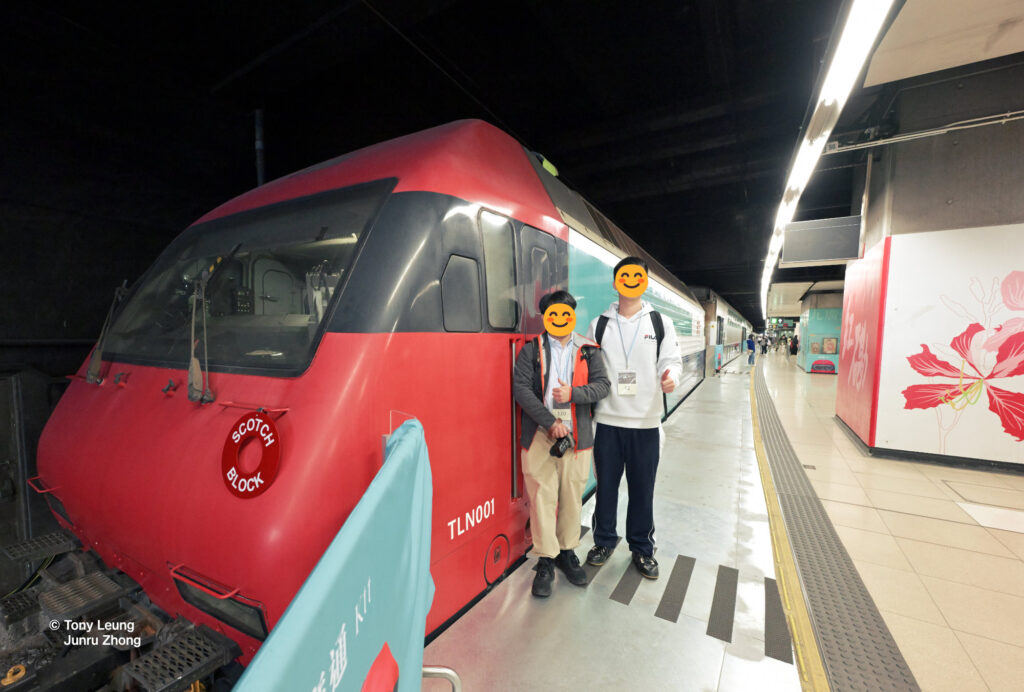
Speaking of the through train, MTR’s distinctive feature was definitely its exclusive double-decker KTT trains, while on the Guangzhou Railway side, I would nominate the braised chicken legs sold by chefs carrying large metal trays, priced at 20 yuan each. The KTT has already been moved to a museum, and people can see it at the “Station Rail Voyage” exhibition at Hung Hom Station. As for the braised chicken legs now served on trains between Guangzhou East/Guangzhou South and Hong Kong West Kowloon Station, I haven’t tried them yet, so I don’t know if they still taste the same as I remember…
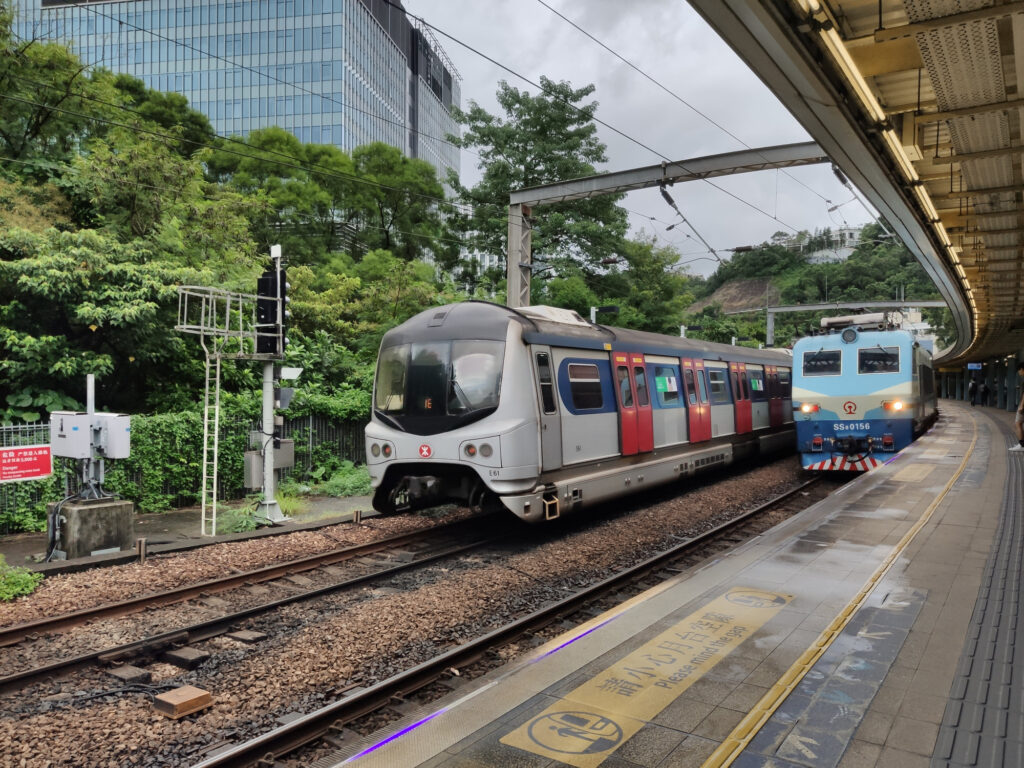
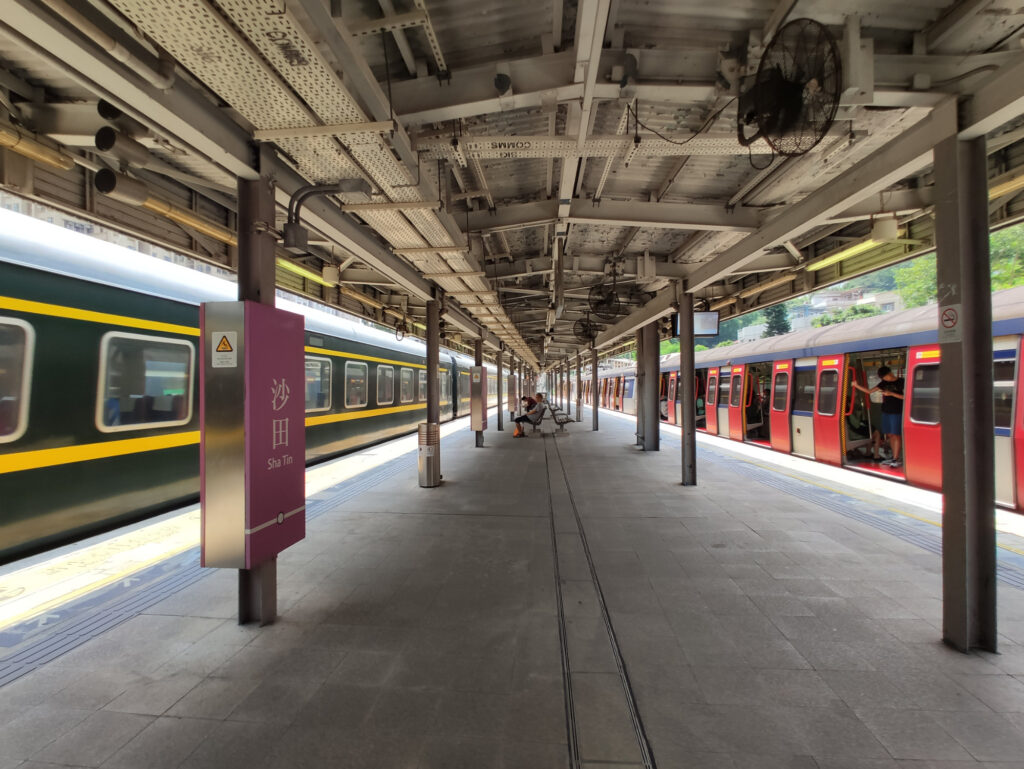
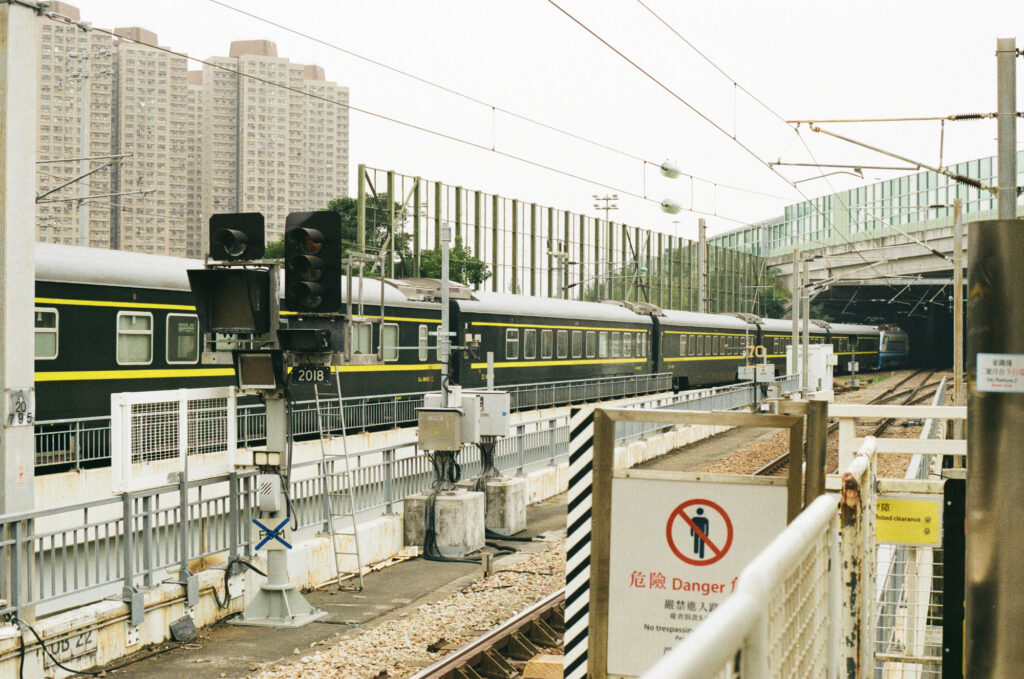
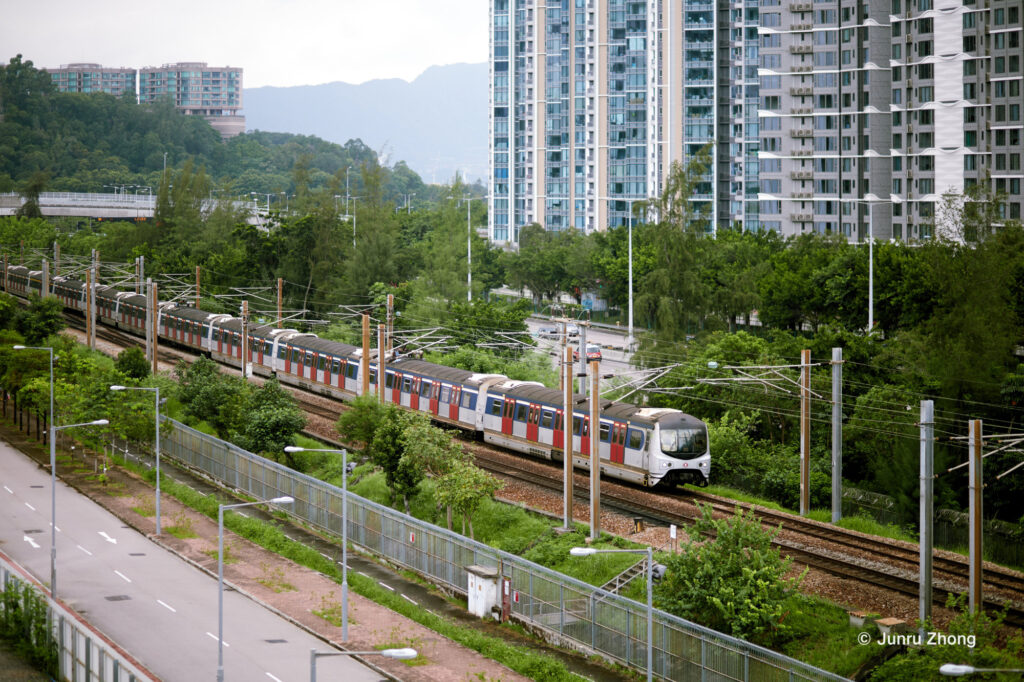
September 2019, SS8 locomotive hauling the 25T Guangzhou-Kowloon Through Train passing University Station.September 2019, the Through Train passing through the main platform at Sha Tin Station, while a commuter train waits on the side platform.November 2019, KTT passing through.January 2020, SS8 locomotive hauling the 25T Guangzhou-Kowloon Through Train passing Tai Po Market Station, southbound to Hong Kong’s Hung Hom Station.January 5, 2020, KTT stopped at Guangzhou East Station.February 2025, me displaying my collection of various Through Train tickets inside the statically exhibited KTT train car at Hung Hom Station.
Mixed Train Formations: How to Prevent Passengers from Running to Catch Trains?
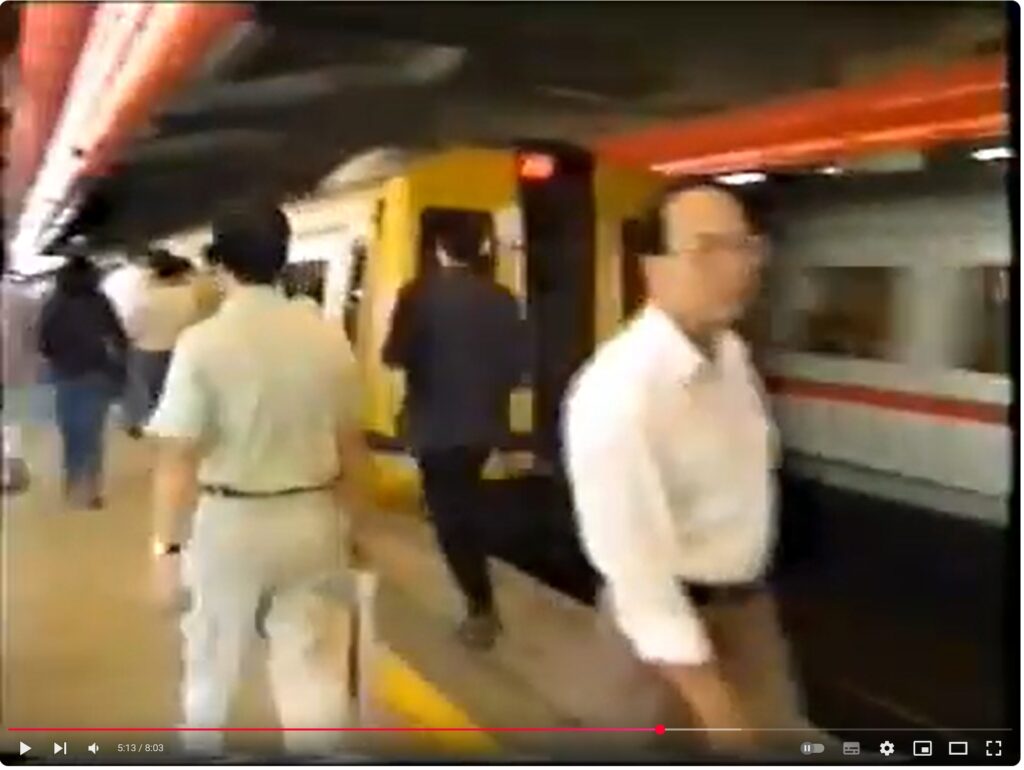
Passengers discovering the train isn’t a 12-car formation, running forward to board. Screenshot from RTHK’s “Hong Kong Connection” (《铿锵集》) aired on October 18, 1990, taken from an online video.
In 1990, an RTHK program “Hong Kong Connection” (《铿锵集》) reported that the Kowloon-Canton Railway (now the East Rail Line) operated trains with various formations, but there were no indications on the platforms about the length of the next train, forcing passengers to find boarding positions only after the train arrived. Many passengers had to run on platforms, creating dangerous situations.
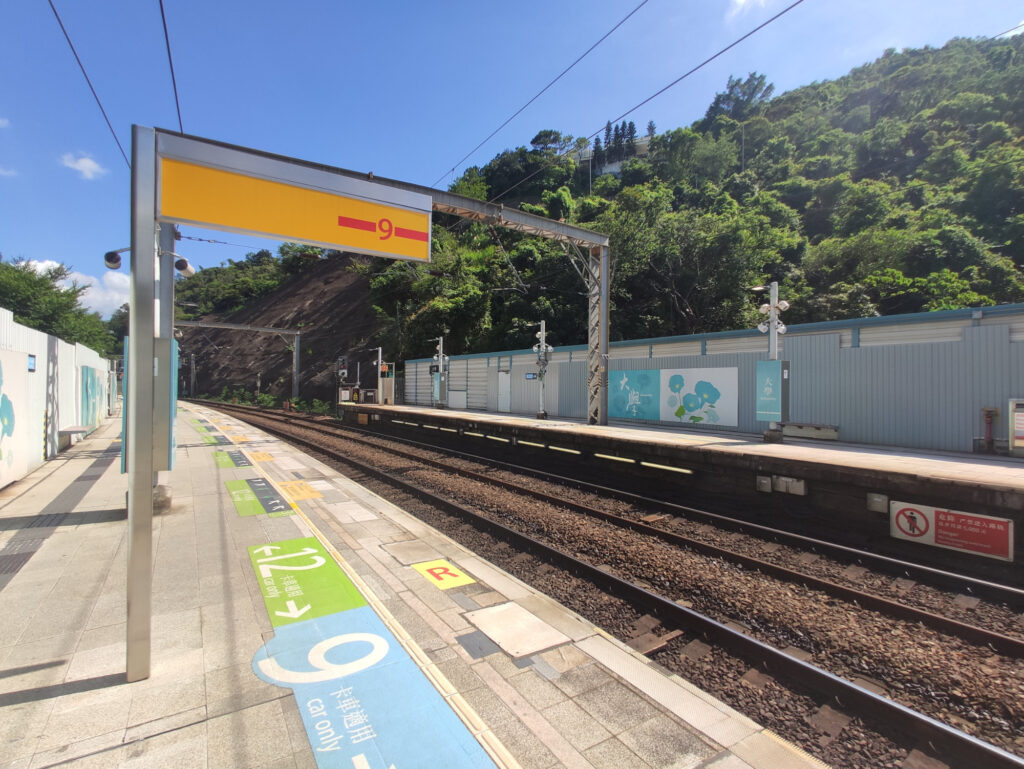
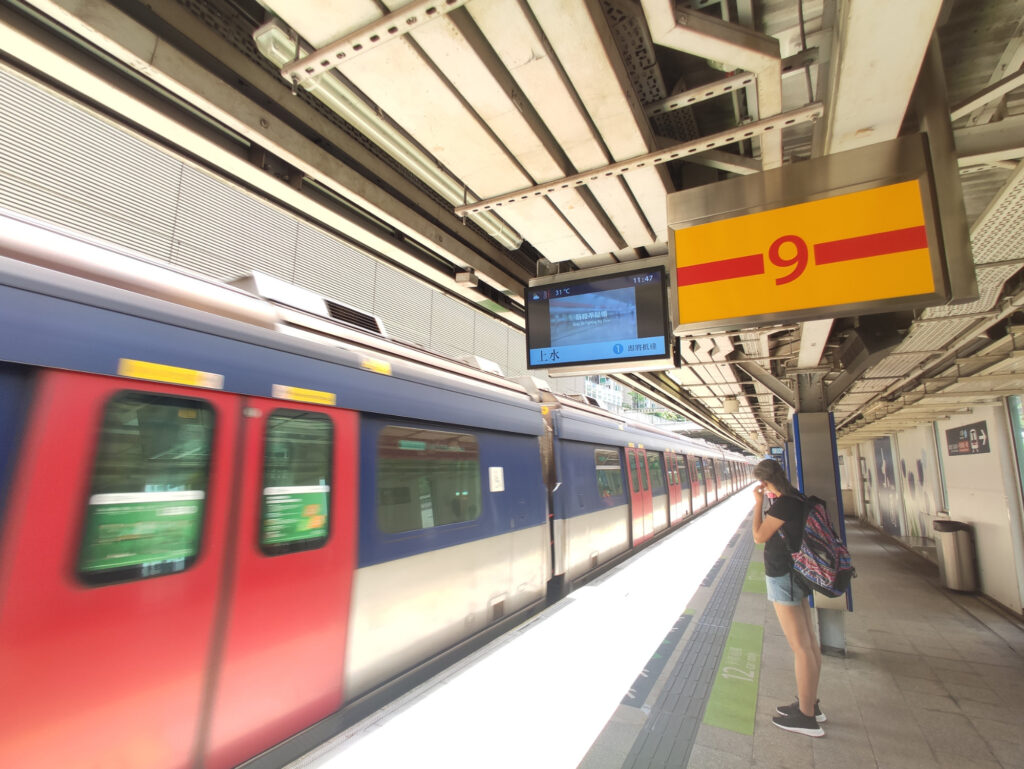
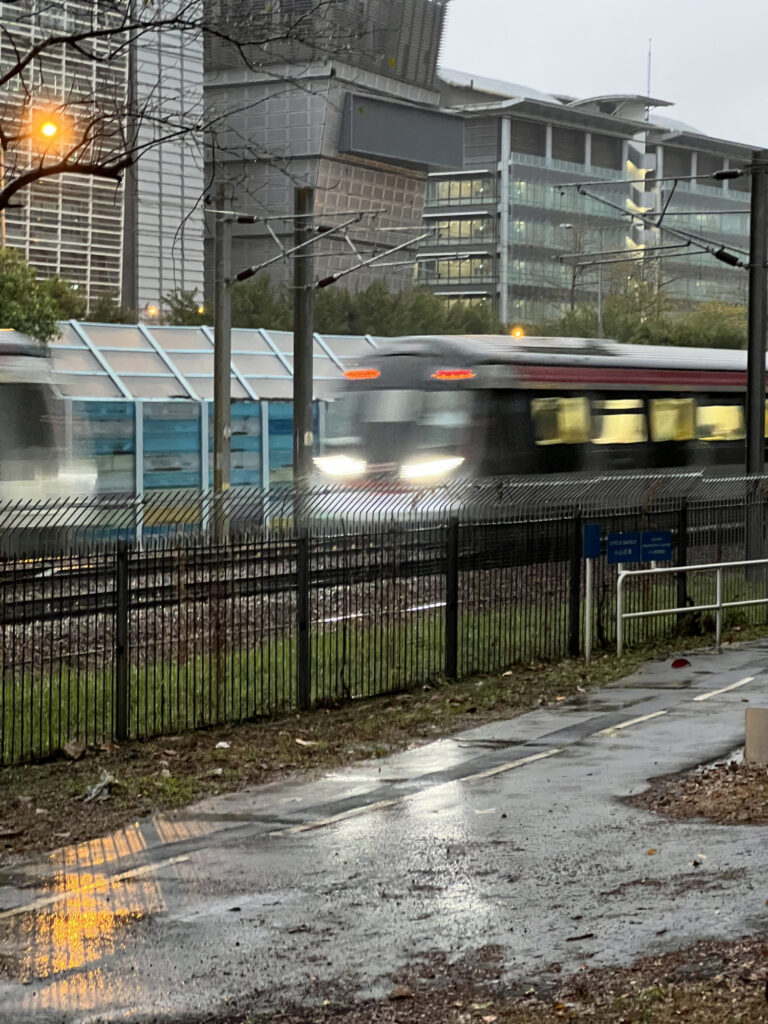
Many years later in 2020, the East Rail Line once again needed to change its train formations. This time, the reason was that two stations on Hong Kong Island lacked sufficient space to build platforms for 12-car trains, so new trains needed to be shortened to 9-car formations. To assist passengers, MTR implemented many measures to clearly indicate boarding positions for both types of trains and displayed upcoming train formation information on platform PIDS (Passenger Information Display System) screens. Finally, after completing the train replacement in 2022, they further optimized stopping positions at each station, placing trains closer to escalators and straight sections of platforms. Only after adjusting these stopping positions could platform screen doors be installed on the East Rail Line.
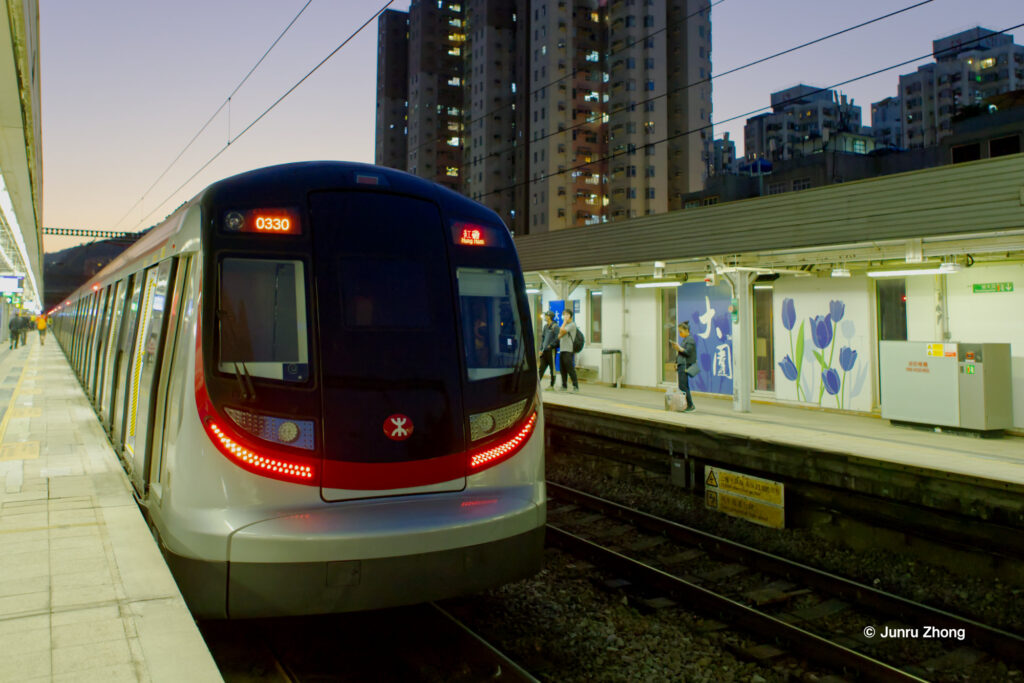
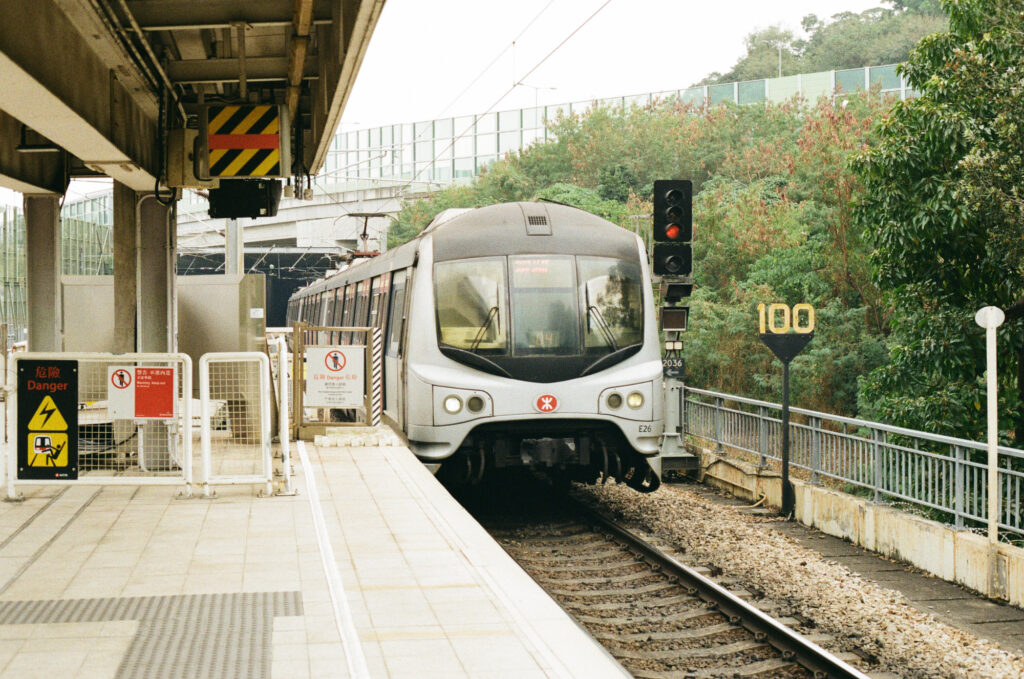
July 2020, 9-car train stopping position sign and floor markings for passengers at University Station.August 2020, 9-car train stopping position sign and an SP1900 train at Tai Wai Station.February 6, 2021, first day of R-Train service, a brand new R-Train stopping at Tai Wai Station.
MLR
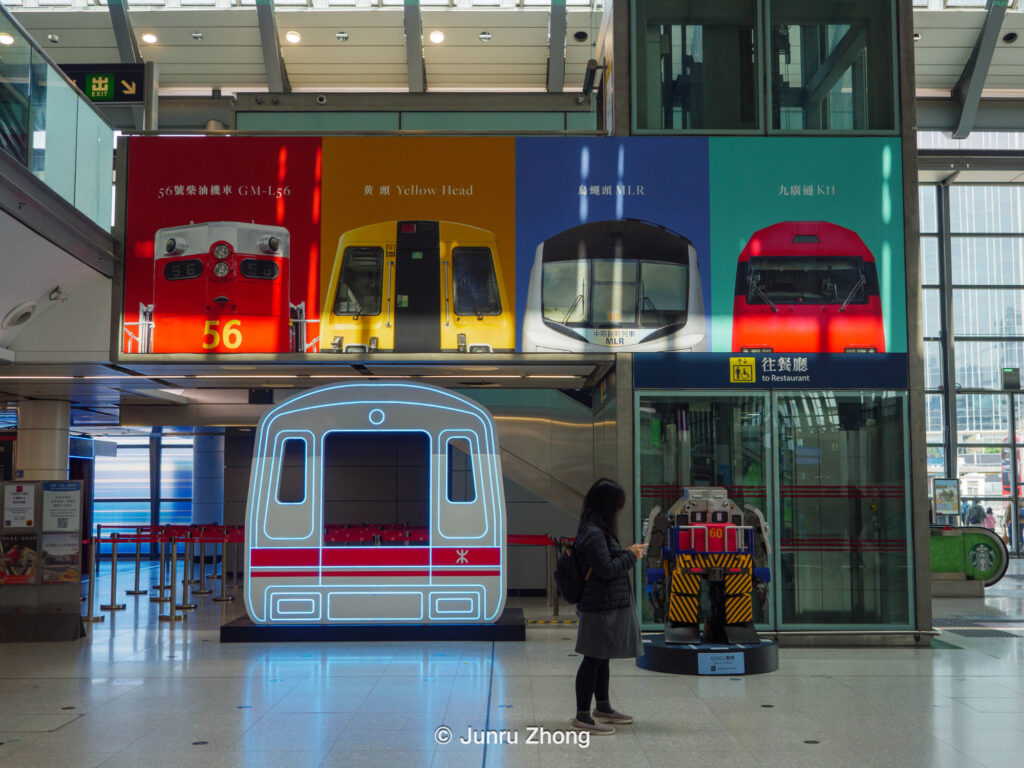
After 40 years of service on the East Rail Line, the “Yellow-Head” / MLR trains finally retired on May 6, 2022. On that day, MTR held a simple yet solemn retirement ceremony for these trains. Due to work commitments, I couldn’t attend in person and could only watch via online livestream. Now, visitors can see four types of preserved original carriages at the “Station Rail Voyage” railway exhibition at Hung Hom Station: MLR standard class and first class cars, along with unrenovated “Yellow-Head” train standard class and first class/baggage composite cars. Additionally, two carriages repurposed as exhibition spaces can be viewed at the Wan Chai waterfront.
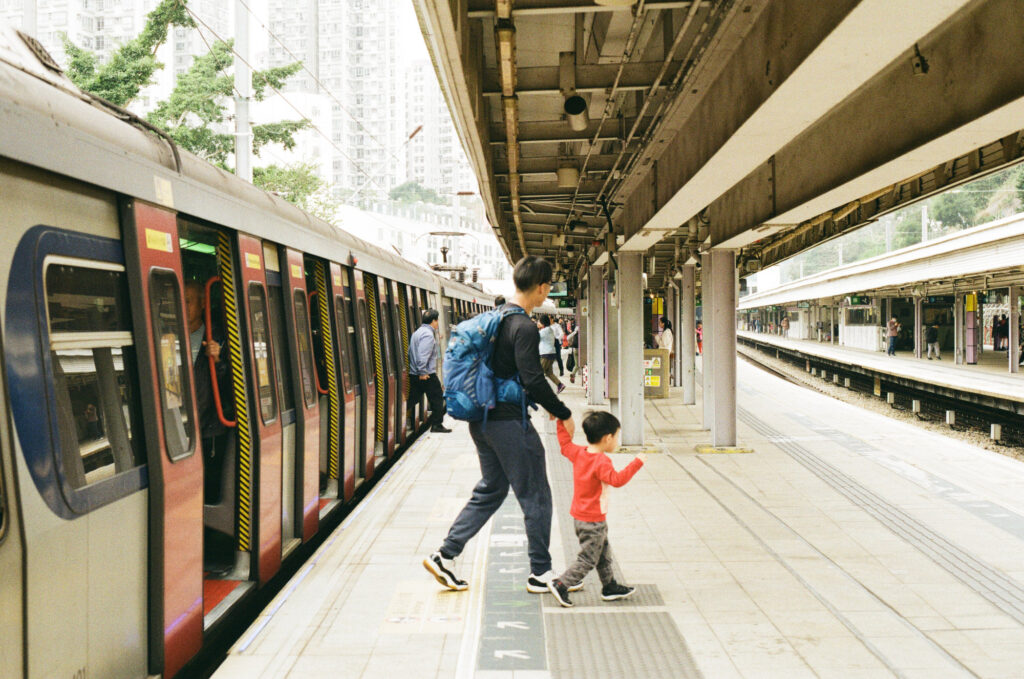
January 2020, a father and son alighting at Tai Po Market Station.January 2020, an MLR train entering Tai Po Market Station.May 6, 2022, the final service day of MLR trains. Me posing with an MLR train during my morning commute.
Epilogue
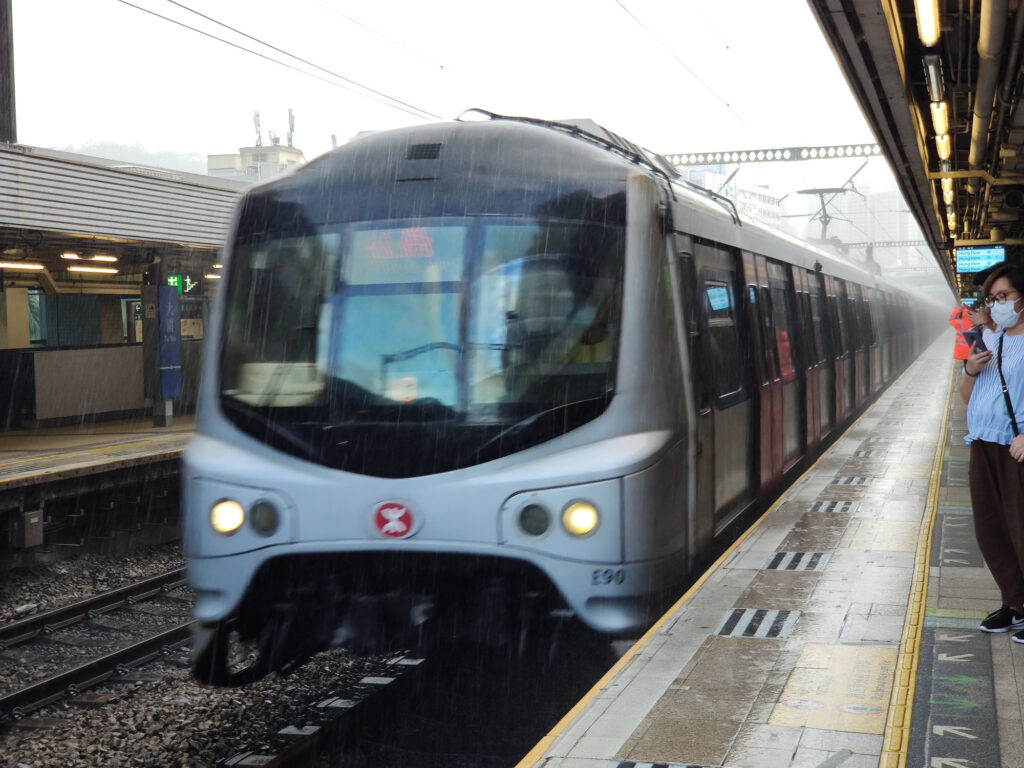
August 2021, an MLR train entering Tai Wai Station during a heavy downpour.February 2022, a high-speed R-Train captured while walking out of school to buy food during the work-from-home period of the pandemic.
As a self-described rail enthusiast, rather than rushing to the front to “drink the first soup” or seeking out “special sightings,” I prefer to record events from an inconspicuous corner in the background. I often contemplate how much effort and negotiation various stakeholders put into planning, constructing, and operating what appears to be an ordinary railway line that we take for granted, all to provide convenience to the masses of passengers. Conversely, I wonder how an established railway line influences passengers’ travel choices and contributes to local development.
Since 1910, the East Rail Line and its predecessor, the Kowloon-Canton Railway, have stood firmly in place, with the route remaining largely unchanged for over a century. Before the New Town Development Plan began in the 1970s, the Kowloon-Canton Railway mostly passed through villages and farmland. After development, nearly every station on today’s East Rail Line (except for the two border crossing stations near Shenzhen) has become surrounded by highly integrated commercial, residential, and transportation complexes. With cross-border passenger flow continuing to surge and the Hong Kong government actively developing the Northern District, this north-south trunk line will inevitably become more crowded and play an even more crucial role.
I hope I will still have the opportunity to witness everything that follows.
May 15, 2022, the concourse of Hung Hom Station on the first day of East Rail Line’s cross-harbor extension.February 2025, entrance to the “Station Rail Voyage” railway exhibition at Hung Hom Station. Sunlight falls perfectly on the headlight position of the large poster, as if the exhibited train is turning on its headlights to welcome visitors.February 2025, my friend and I posing with the statically displayed KTT locomotive at the “Station Rail Voyage” railway exhibition at Hung Hom Station.
Glossary of Terms
East Rail Line: A heavy rail line in Hong Kong. It runs from Lo Wu and Lok Ma Chau stations in the north (adjacent to Shenzhen) to Admiralty station on Hong Kong Island in the south.
Sha Tin to Central Link (SCL): The project name for the Tuen Ma Line and East Rail Line cross-harbor extension, meaning “Sha Tin to Central Link.”
Through Train: A passenger train service operating between mainland China and Hung Hom Station in Hong Kong. The service began in the 1910s when the Kowloon-Canton Railway (now the Guangzhou-Shenzhen Railway and East Rail Line) first opened. Service was restored in 1979 following post-war interruptions, operated until 2020 when it was temporarily suspended due to the COVID-19 pandemic, and was effectively cancelled in 2024 due to the closure of various railway border checkpoints and control points.
SP1900: A train model that formerly served on the East Rail Line, manufactured by Japan’s Kinki Sharyo and Kawasaki Heavy Industries. It entered service in 2001 and was transferred from the East Rail Line in 2021, after which it was modified for service on the Tuen Ma Line.
R-Train: The current train model on the East Rail Line. It is currently the only passenger train model on the East Rail Line, manufactured by Hyundai Rotem of South Korea. The name “R-Train” is derived from the manufacturer’s name.
MLR: Mid-Life Refurbishment Train. A passenger train that was once active on the East Rail Line, refurbished and reconfigured from the “Yellow-Head” trains. This model was fully retired on May 6, 2022.
Yellow-Head: Metro Cammell EMU trains, nicknamed for their yellow-painted fronts. These trains were manufactured by Metro Cammell of the UK in the 1980s-1990s and entered service during that period. In the 2000s, they were refurbished and reconfigured into MLR trains.
Special Sighting: A term used by Hong Kong bus enthusiasts, abbreviated from “Special Observation.” It refers to bus models that are not supposed to or rarely seen operating on particular routes but are spotted doing so.
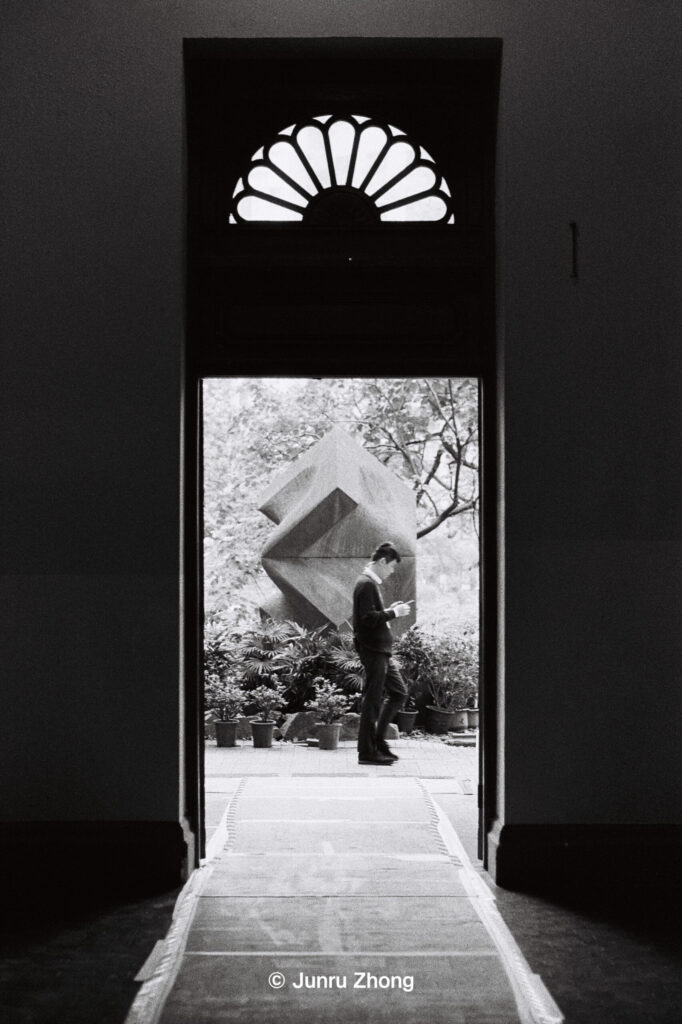
When first learning photography, both textbooks and tutorials will introduce symmetry as a basic composition technique. A common explanation for symmetrical composition is: using symmetry techniques to design images gives them a sense of solemnity and order.
In my personal opinion, designing a photo based on symmetry is undoubtedly a simple and not easily mistaken method. I often use the symmetry technique to shoot static subjects such as architecture and landscapes. However, an unchanging image can easily become monotonous and boring. In my recent shoots, I have tried to introduce dynamic or contrasting elements into symmetrical static scenes to make the images rich and interesting.
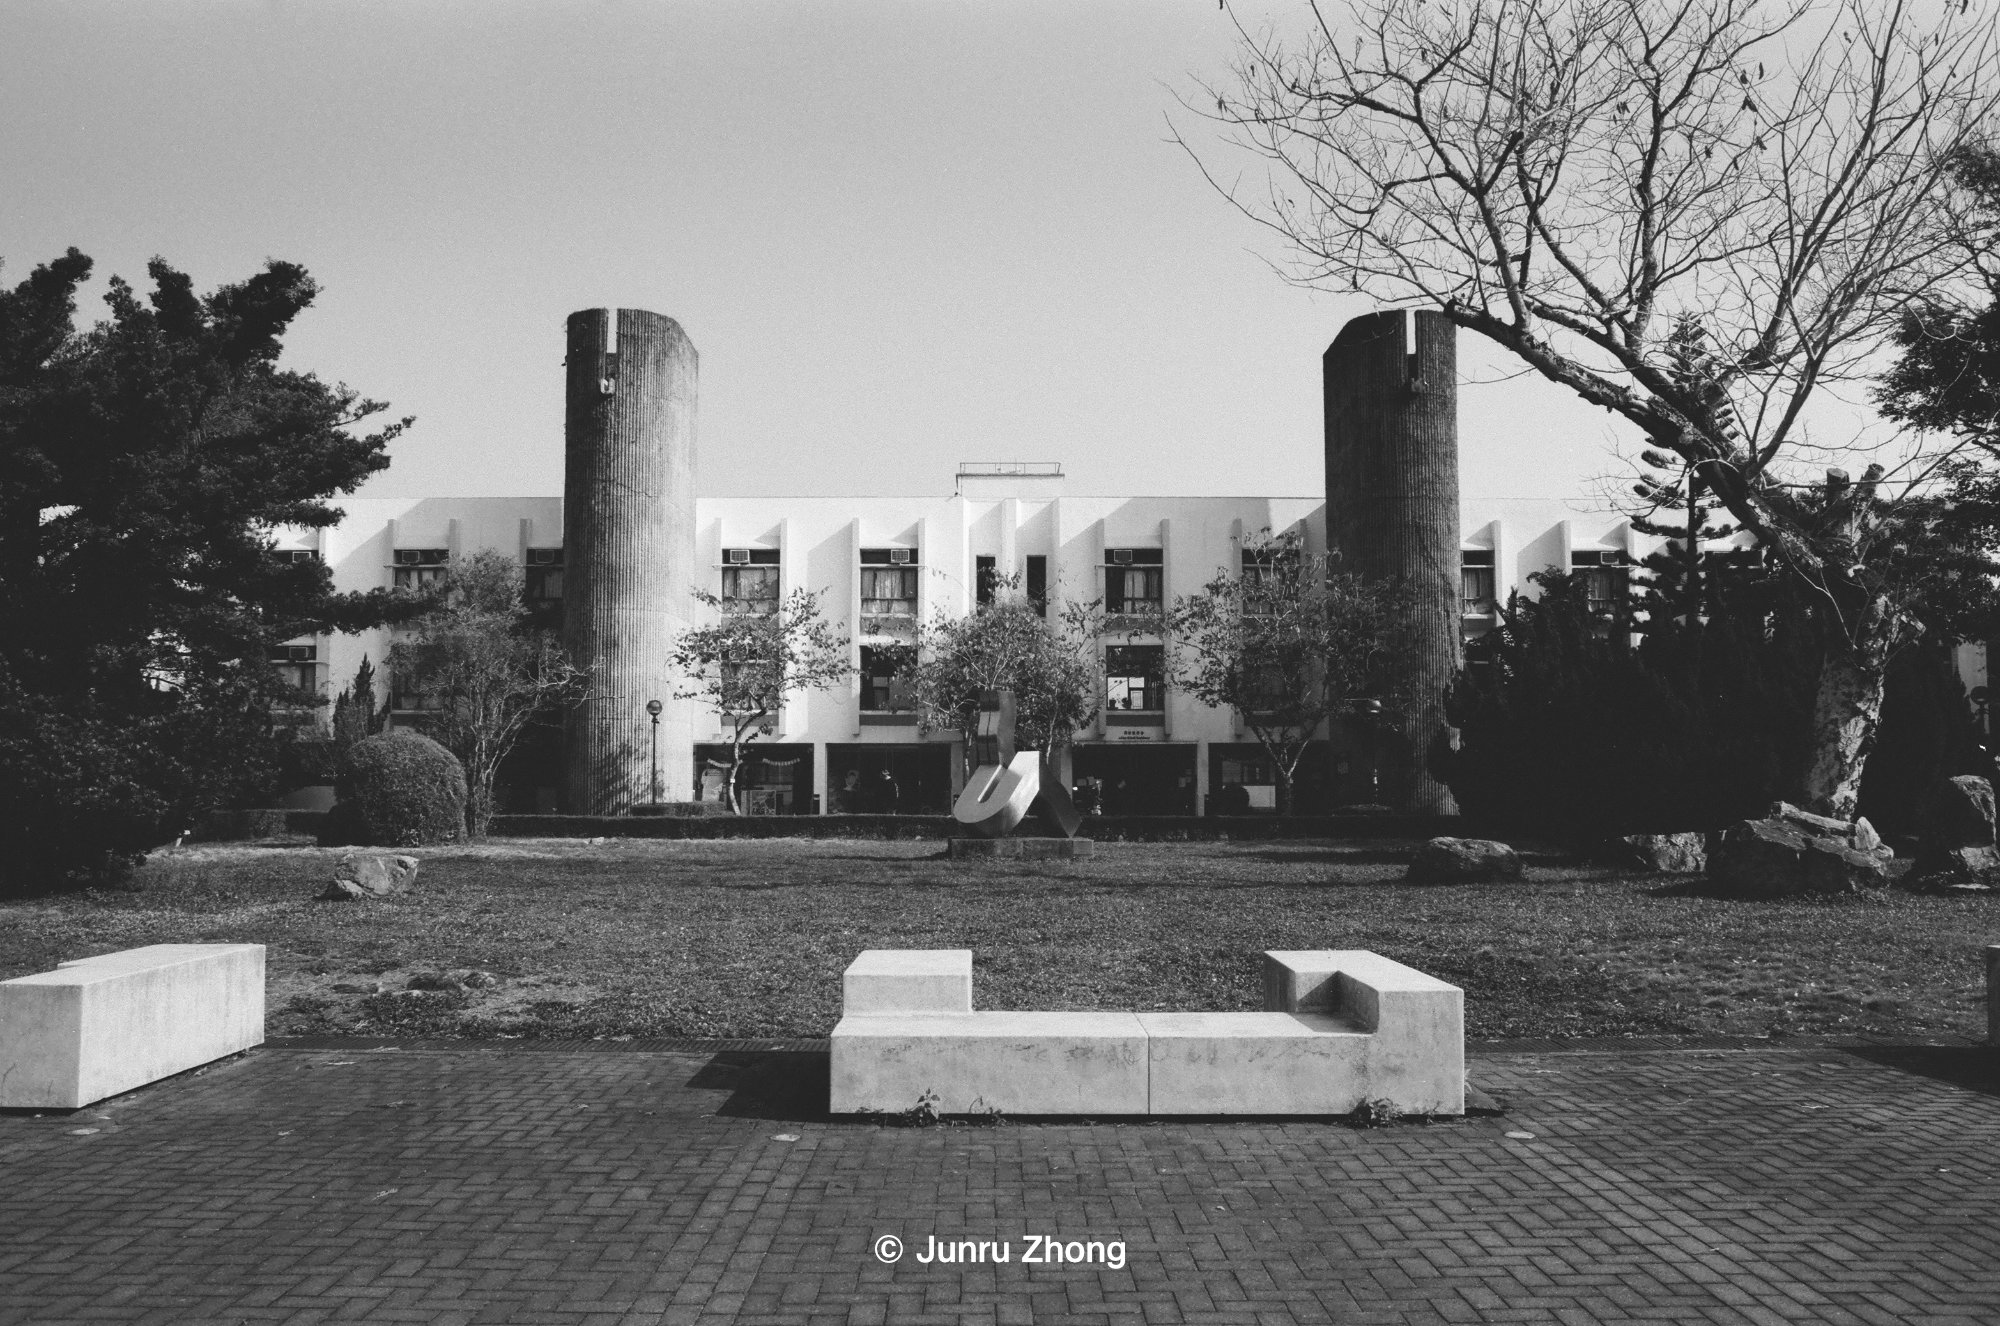
The Chinese University of Hong Kong owns more than 20 brutalist buildings. These buildings mostly exist among the first batch of campus constructions from the 1960s to 1970s. Bob Pang, the author of Unknown Brutalist Architecture in Hong Kong, and his team have recently launched a special research project, collecting and organizing local brutalist architecture into the aforementioned book, in which the Chinese University plays a significant role. The “CUHK in Focus” column has done a detailed report on Pang’s work. By the time the photos were taken in 2025, I had already lived on the CUHK campus for over 4 years. The publication of the above-mentioned book sparked my interest in the distinctive buildings around me, leading to the following few photographs.
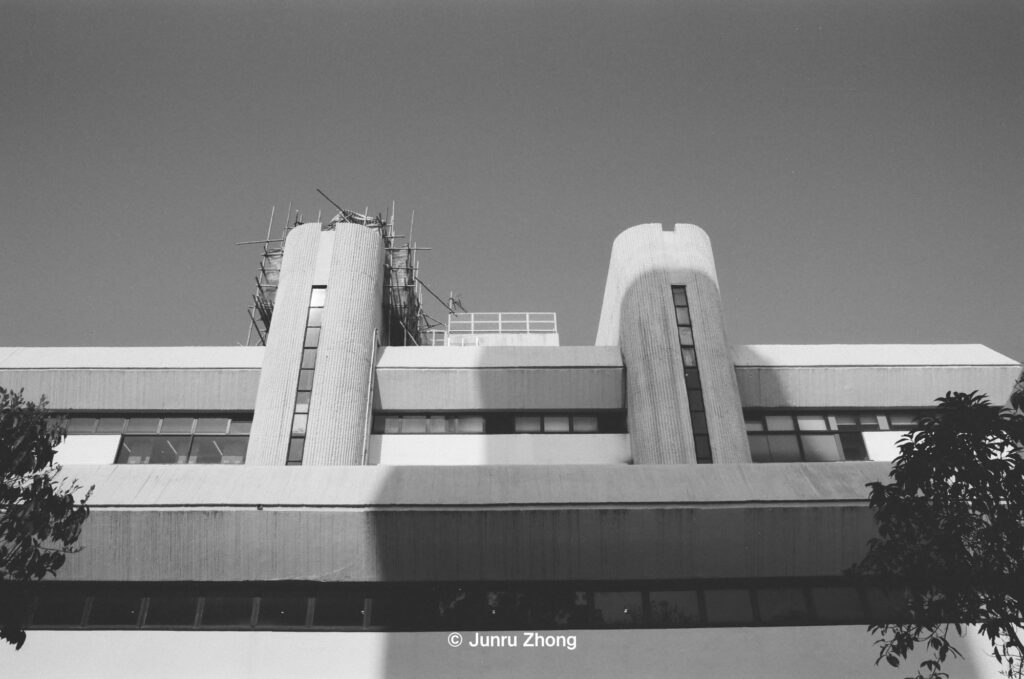
Adam Schall Residence, United College, CUHK Nikon F80s + Nikkor-N Auto 28mm F2.0; Fujifilm ACROS 100 II; Developed by Megatoni Production.Wu Chung Library, United College, CUHK Nikon F80s + Nikkor-N Auto 28mm F2.0; Fujifilm ACROS 100 II; Developed by Megatoni Production.
United College has a large number of brutalist buildings. These two photos were taken at the Adam Schall Residence and the Wu Chung Library, respectively. At first glance, both buildings feature two columnar sections in the middle. The columns in the library are two staircases, while for the dormitory, I could only guess they are also staircases as I was unable to enter.
When taking the photos, I placed the two columnar stairwells in the center of the frame as dividing lines, using their symmetry to create an impression of stability for the building. However, the sunlight entering from the side created asymmetrical shadows on the building’s surface, creating contrast in the picture and conveying the time of day the photo was taken. In addition, there is a certain degree of contrast in the scenery of both photos: such as the two trees, one high and one low, in front of the Adam Schall Residence; and the staircase roof on the left side of the Wu Chung Library that is under repair. The contrast within the symmetry creates a good visual effect.
The Universities Service Centre for China Studies, University Library, CUHK Nikon F80s + Nikkor-N Auto 28mm F2.0; Fujifilm ACROS 100 II; Developed by Megatoni Production.
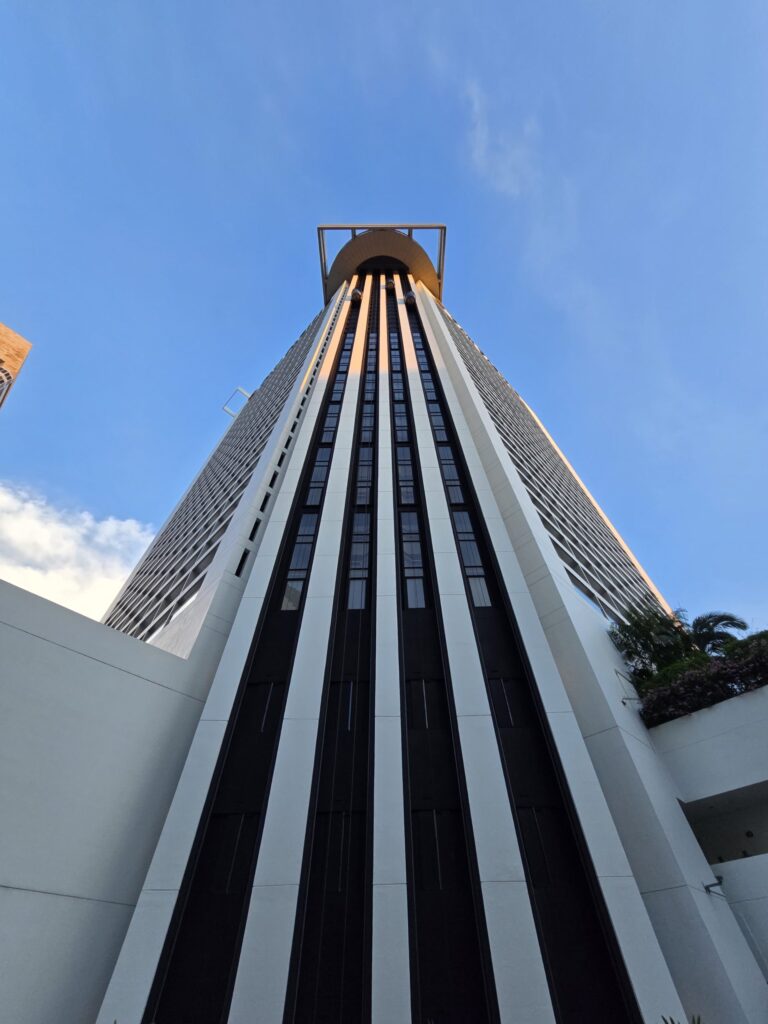
Returning to the Central Campus, the University Library is also a brutalist building of the same era. The photo above was taken at the 8-9th floor of the Tin Ka Ping Building in The Universities Service Centre for China Studies. Due to the excessive light contrast causing metering failure, this photo did not fully reflect my creative intention at the time: in the shadow area below the picture, you can see that there are partitions in the middle of the desks, but the partitions of the two desks are not perfectly aligned, and these partitions are also not aligned with the windows at the end. Similarly, the window at the end does not fall exactly in the center of the space formed by the bookshelves on both sides. Each object in the picture seems to be symmetrical on its own, but they are not symmetrical within this space.
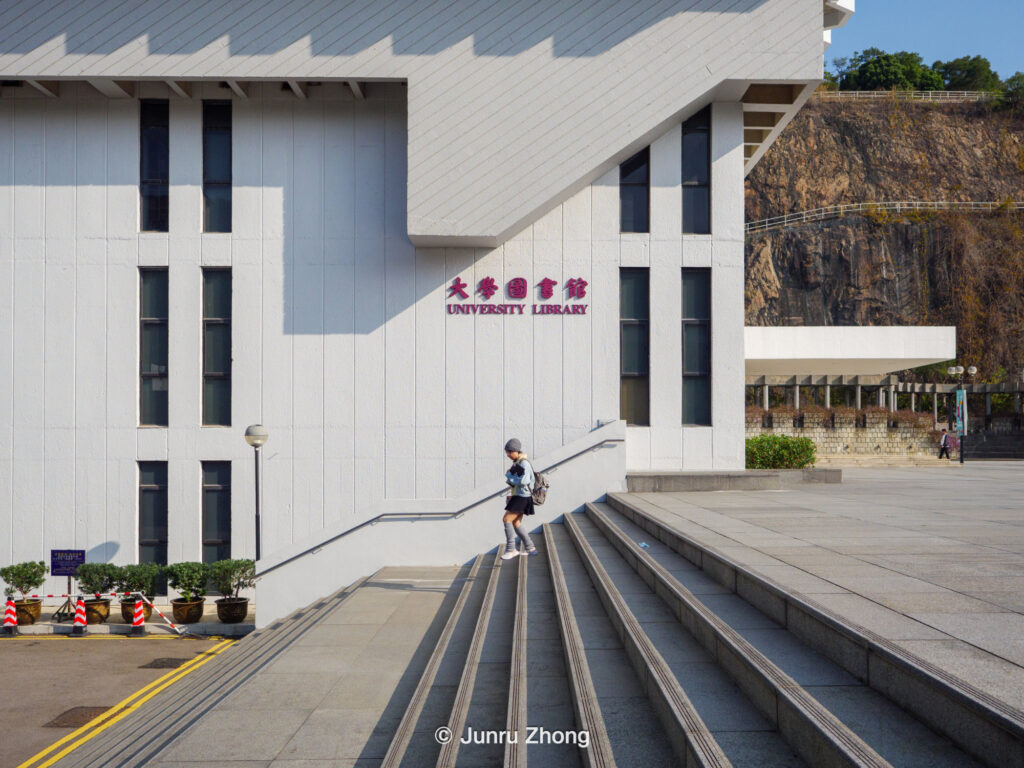
I believe the slope of these few steps must be deliberately parallel to the protrusion of the University Library. Under the right sunlight, the angle of the shadow also happens to align with the building. The two parallel diagonal lines at the top and bottom of this scene form a perfect visual focal area. At this moment, a passerby walks to the center of the aforementioned visual focal area, completing the last piece of the puzzle for the perfect picture.
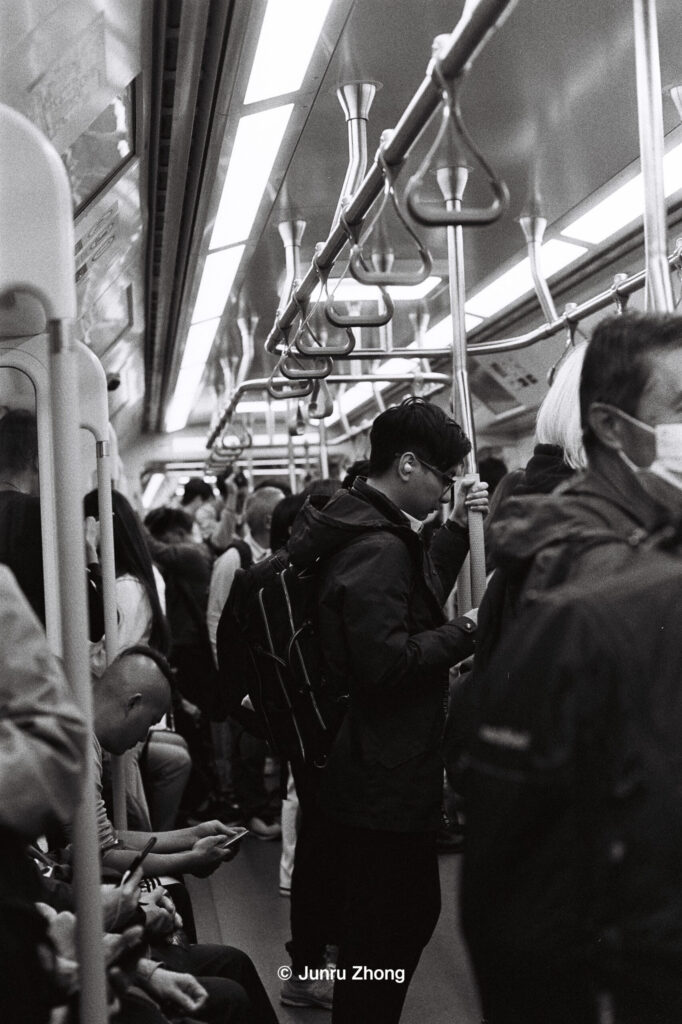
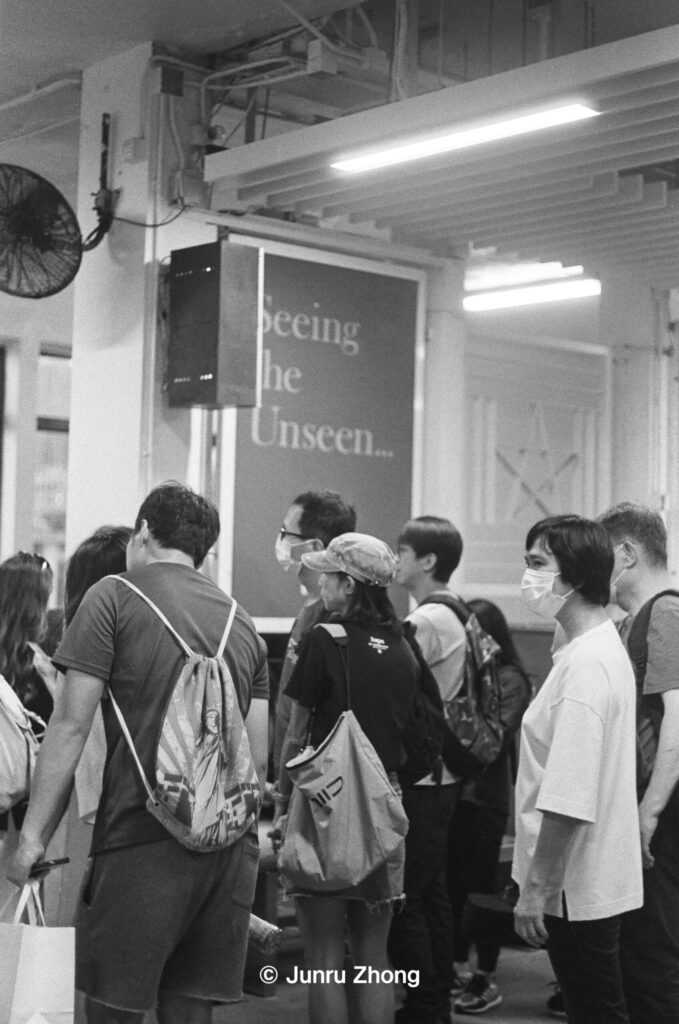
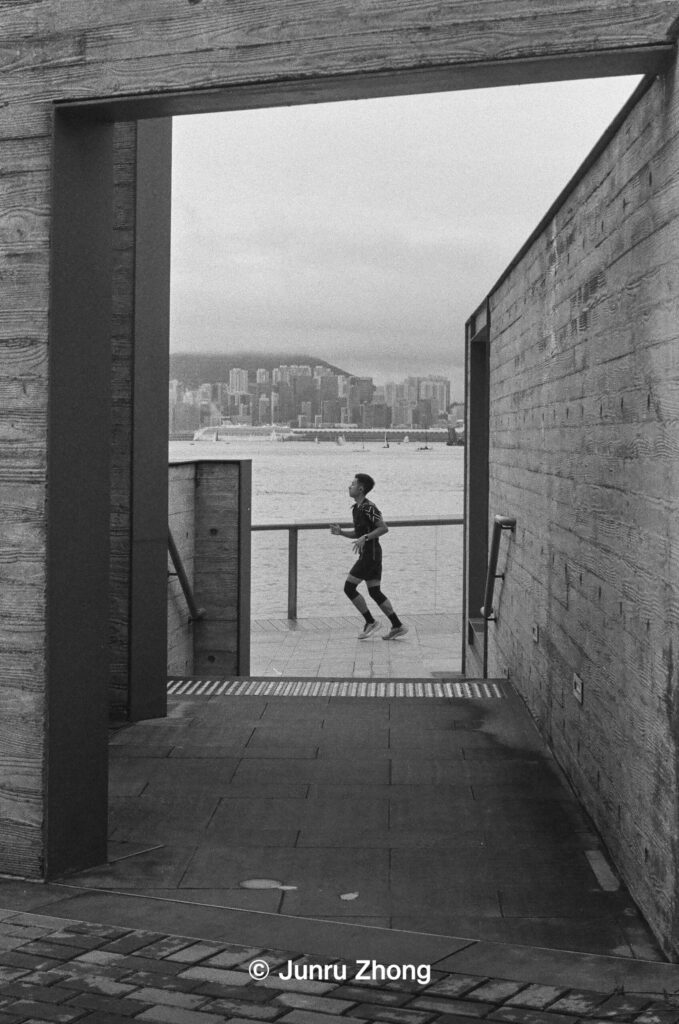
I love black and white (B&W) photography a lot. It makes me think simple and pure. The elimination of the colour forces me to think about the composition, subjects, and the story I would like to tell.
By now, most of my B&W photos have been taken in film and slightly adjusted with Photoshop.
Kodak EASTMAN DOUBLE-X 5222 @ HKUKodak EASTMAN DOUBLE-X 5222 @ East Rail LineIlford XP2 Super 400 @ City One ShatinIlford HP5 Plus @ Tsim Sha Tsui Star FerryIlford HP5 Plus @ Golden Bauhinia Square, Wan ChaiIlford HP5 Plus @ Hollywood Road, Central
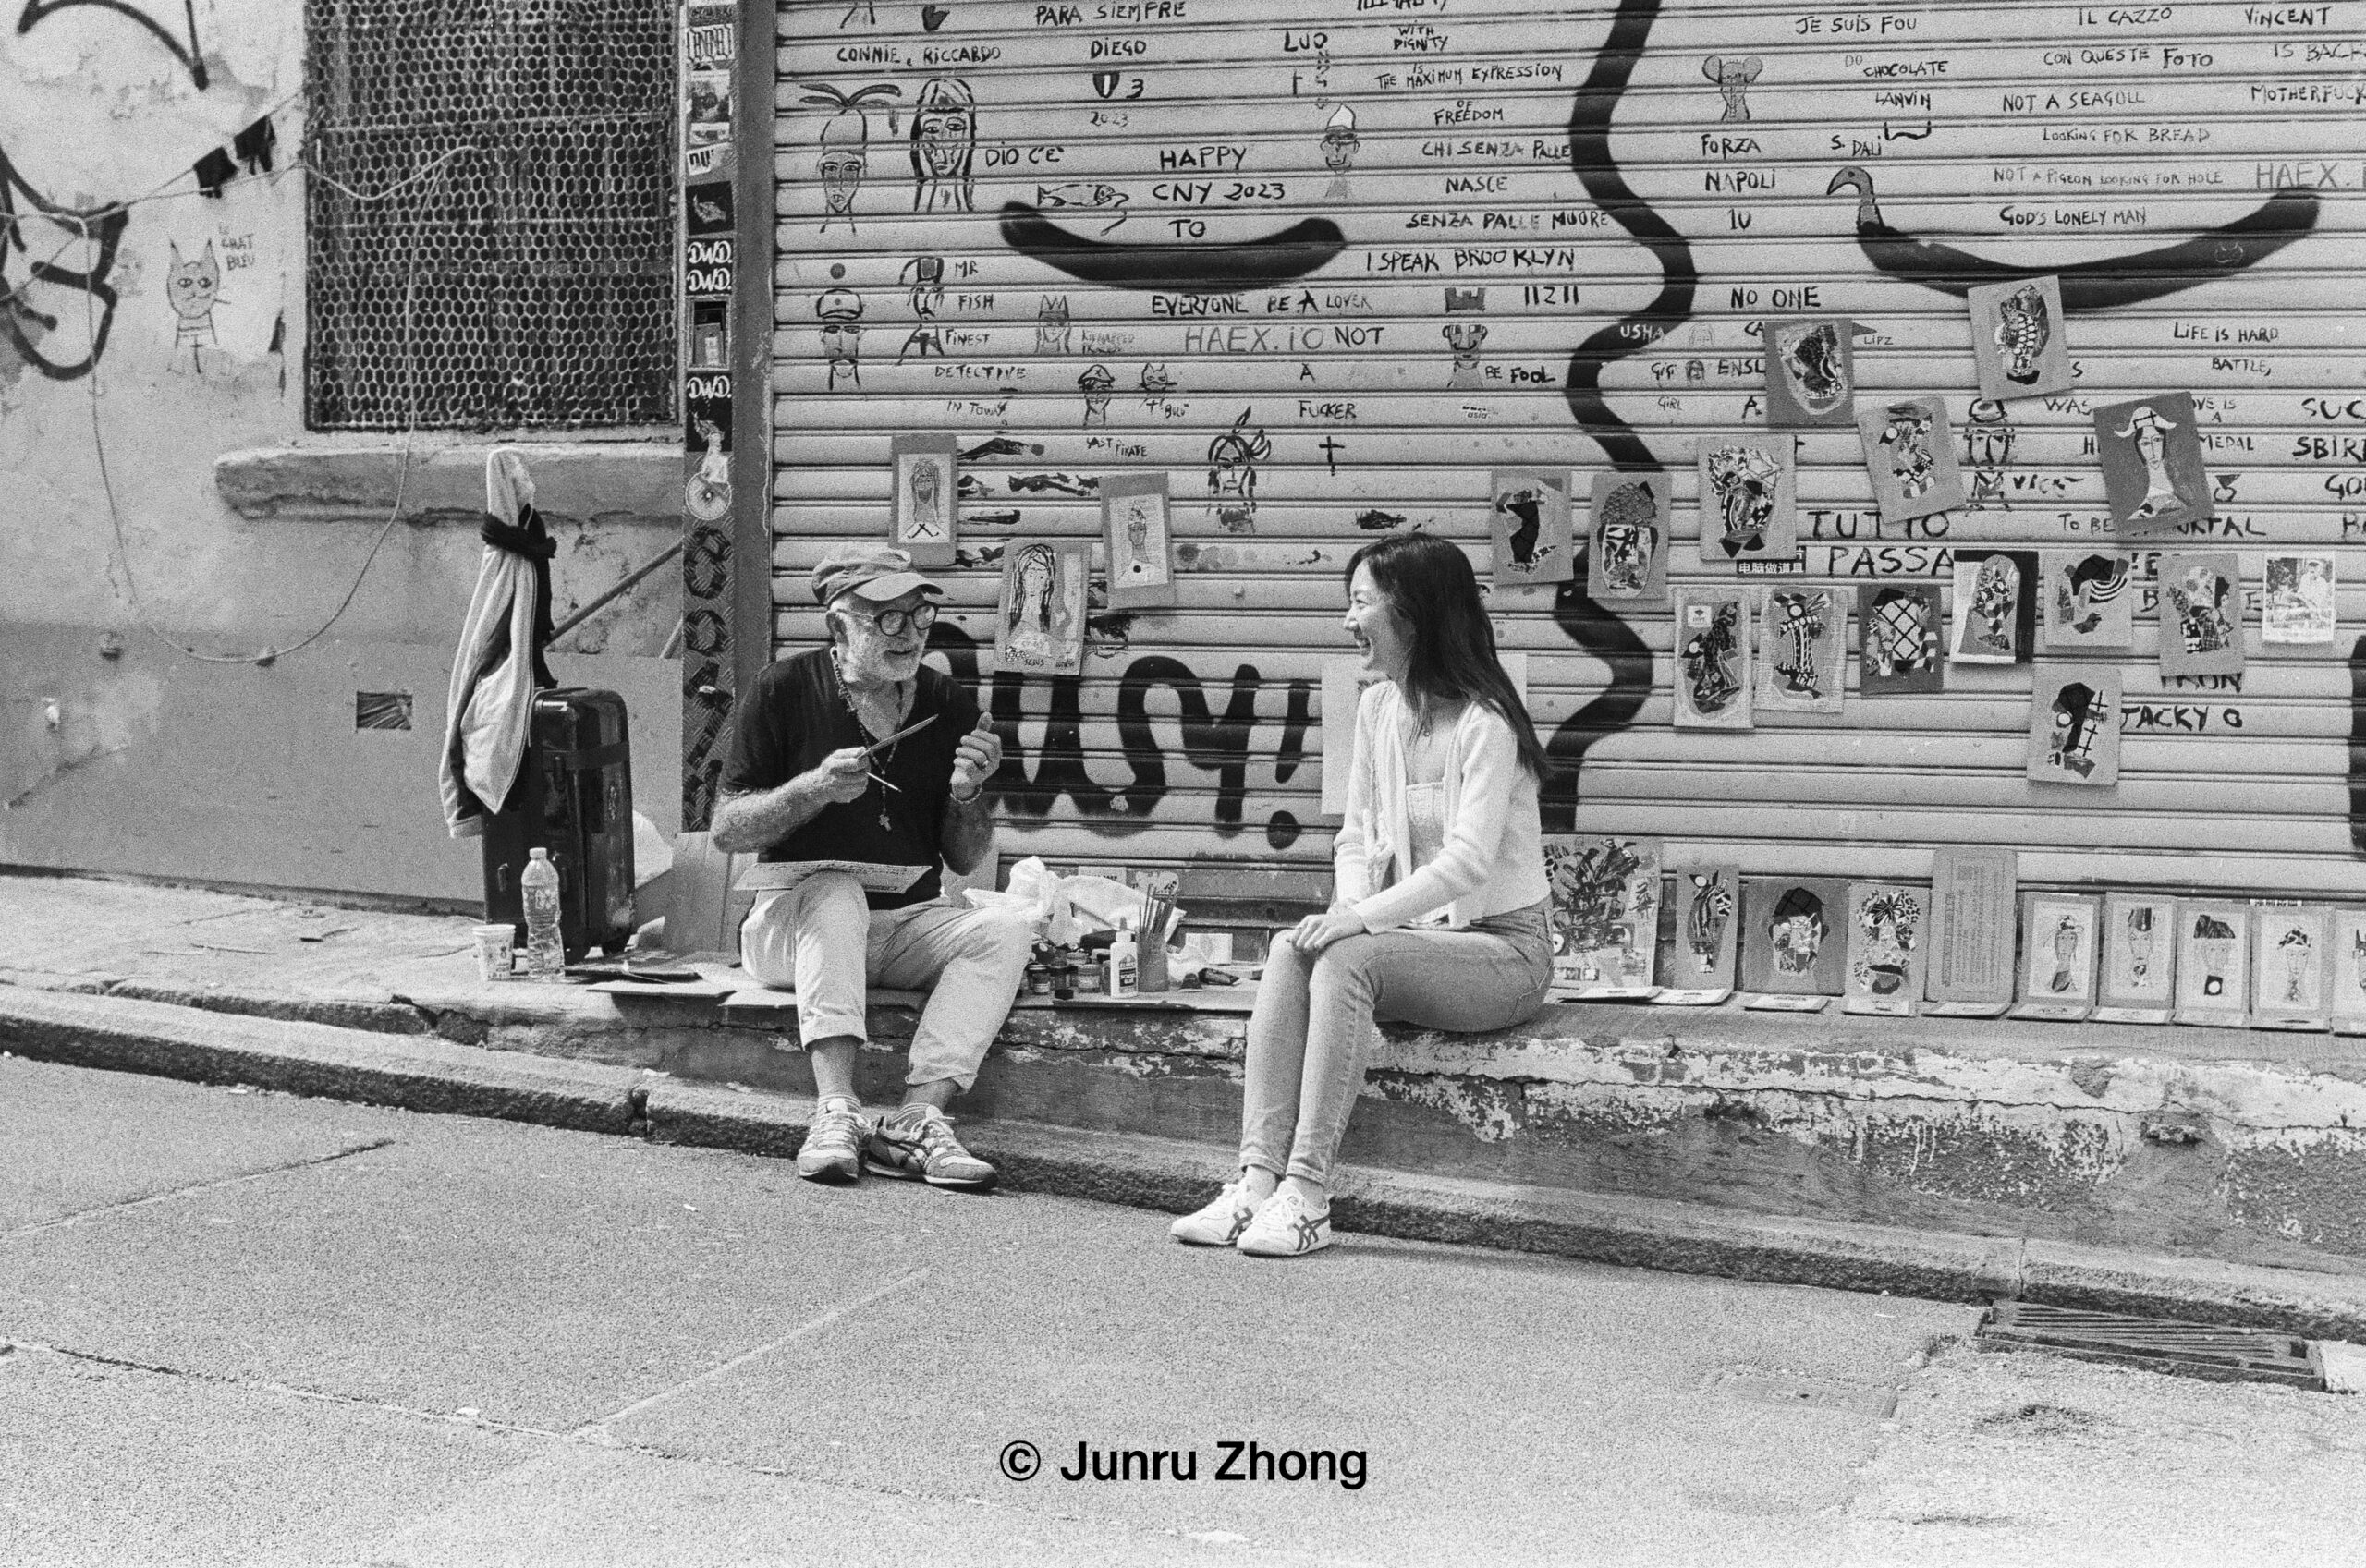
Quanzhou (泉州) in Fujian, China, is a historical city that I happen to have several friends from there. I randomly chose to relax there. Without hesitation, I booked the hotel and transport one week before departure.
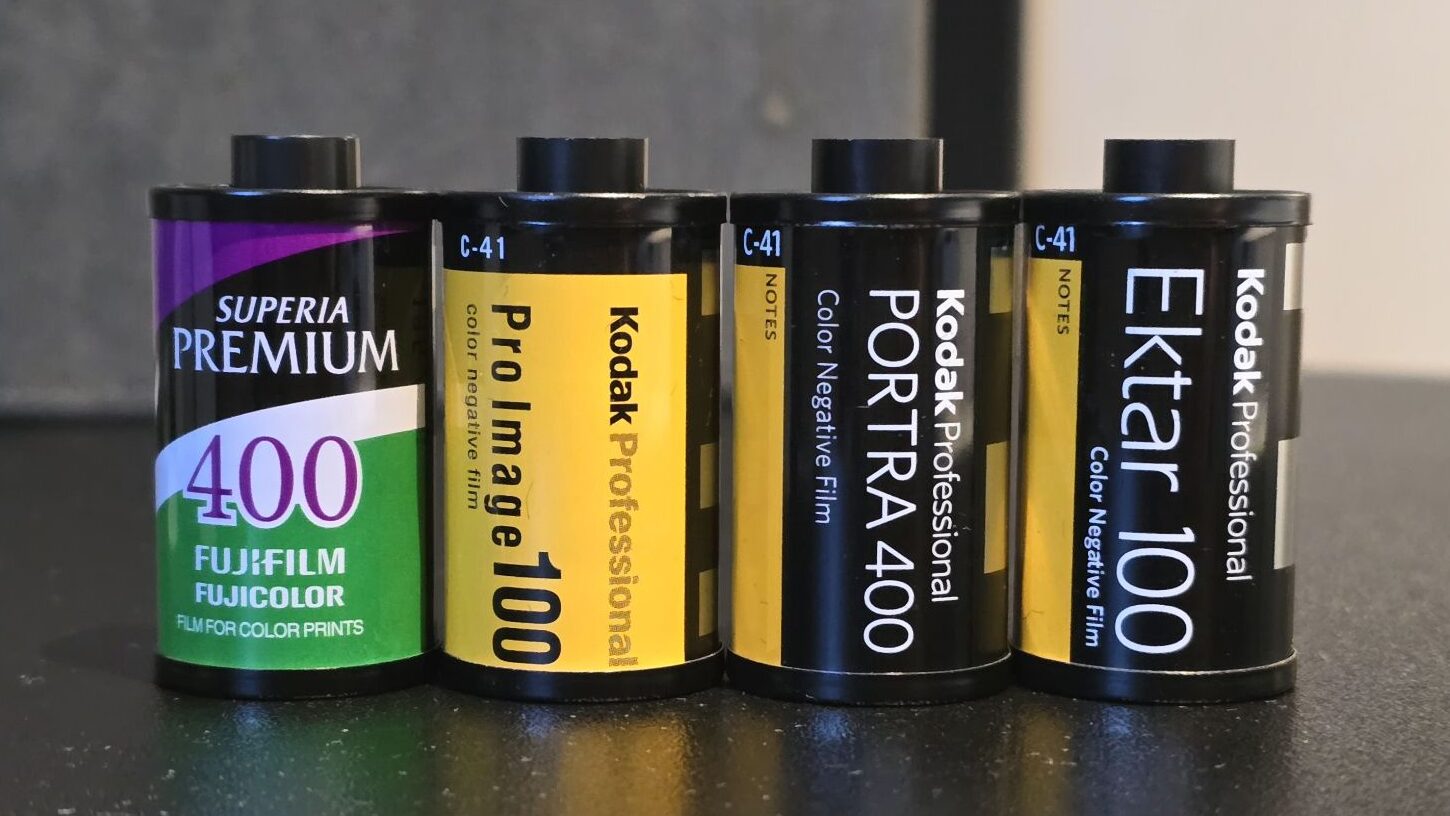
I brought four rolls of 135 colour negative films, my film SLR and three lenses with me. Yes, there is no digital camera. I sent the negatives to the New Color (新彩) studio in Guangzhou for development and digitisation (scanning). I later processed the TIFF files with Nikon’s NX Studio software.
The photos were taken from 2 to 5 July 2024, and the film rolls were developed on 7 July.
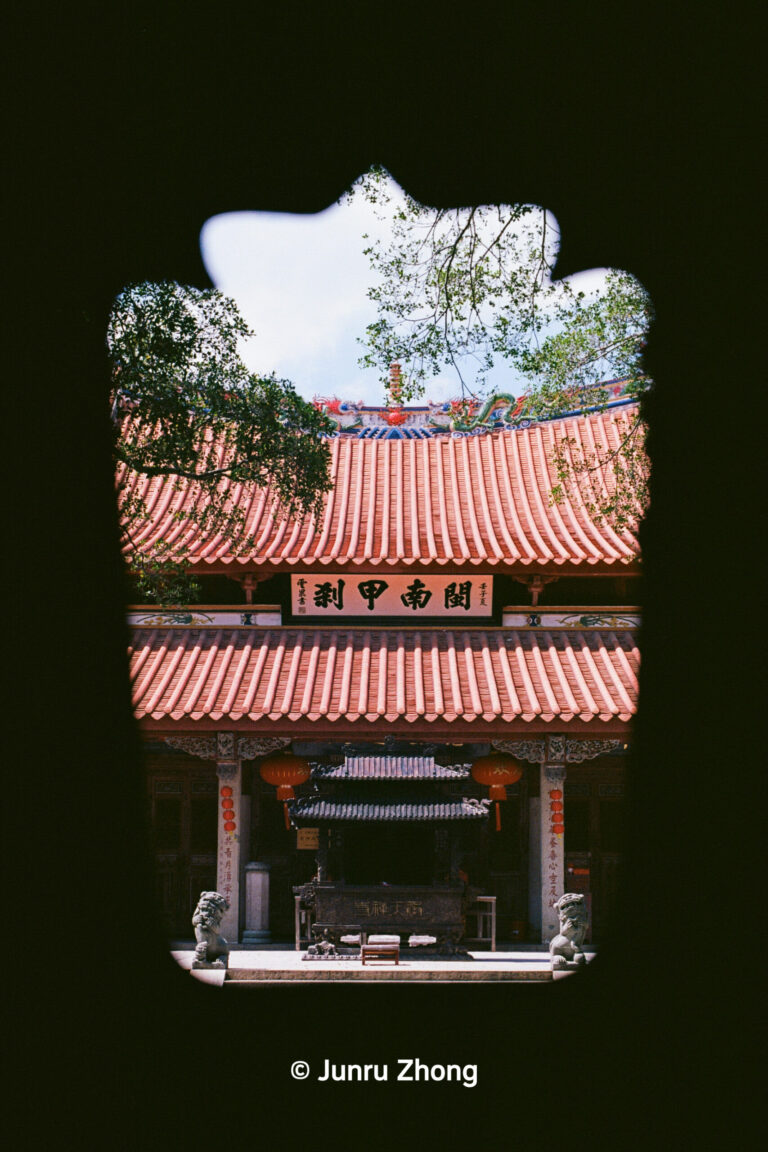
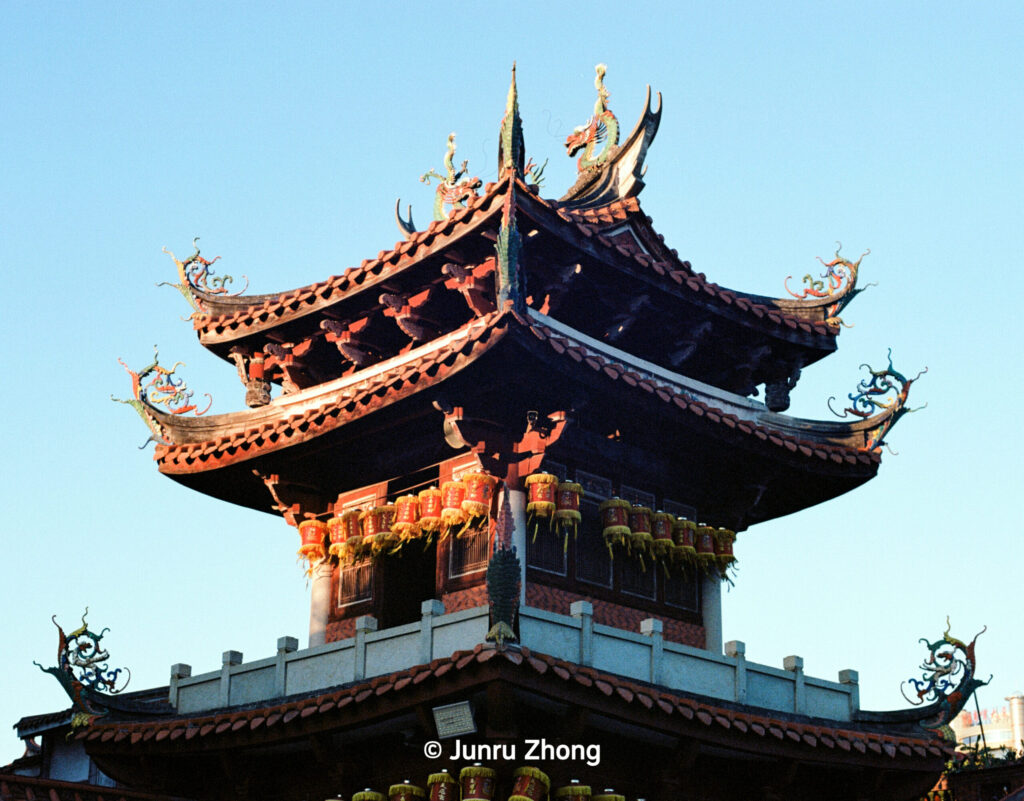
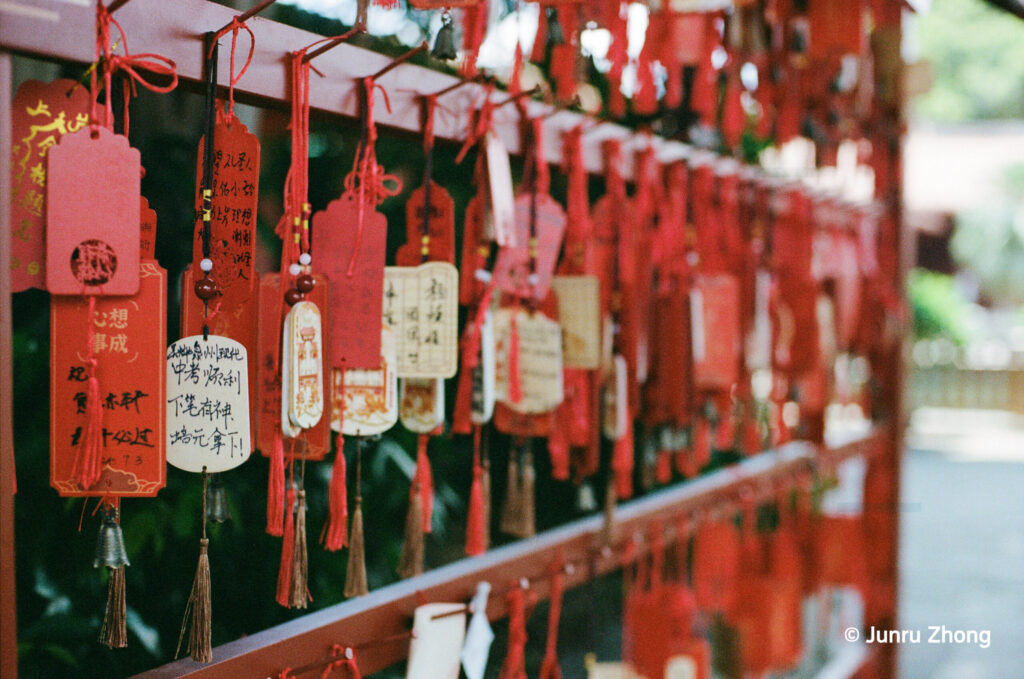
Temples
Kodak Professional Ektar 100Kodak Professional Ektar 100Fujifilm Superia Premium 400
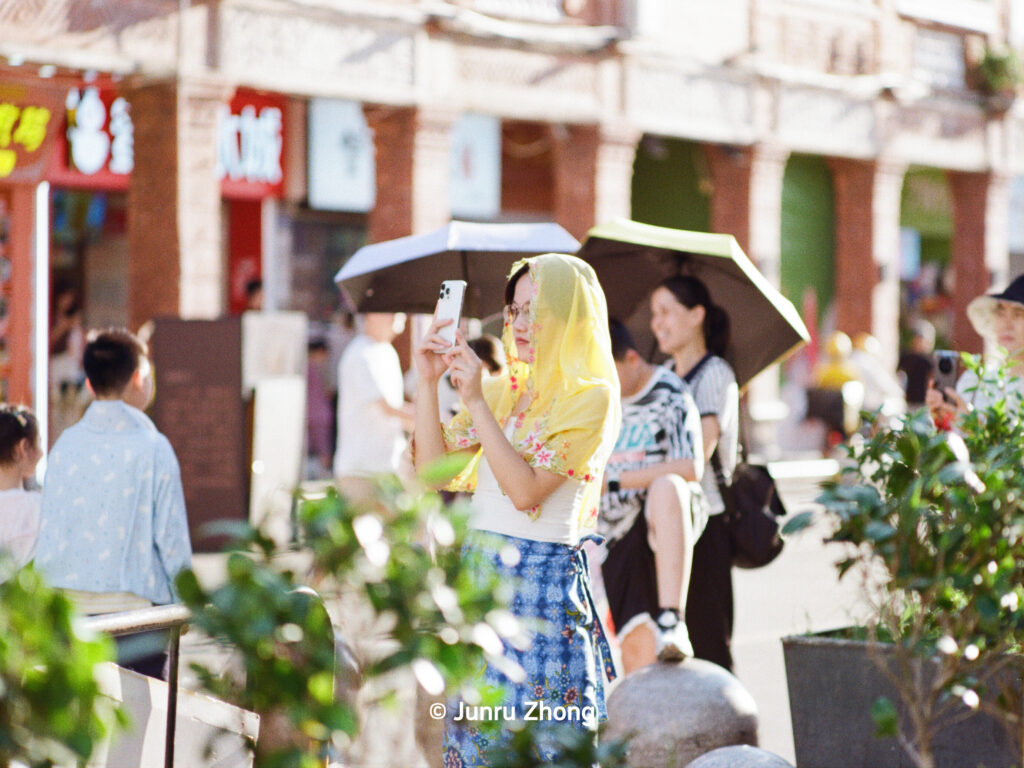
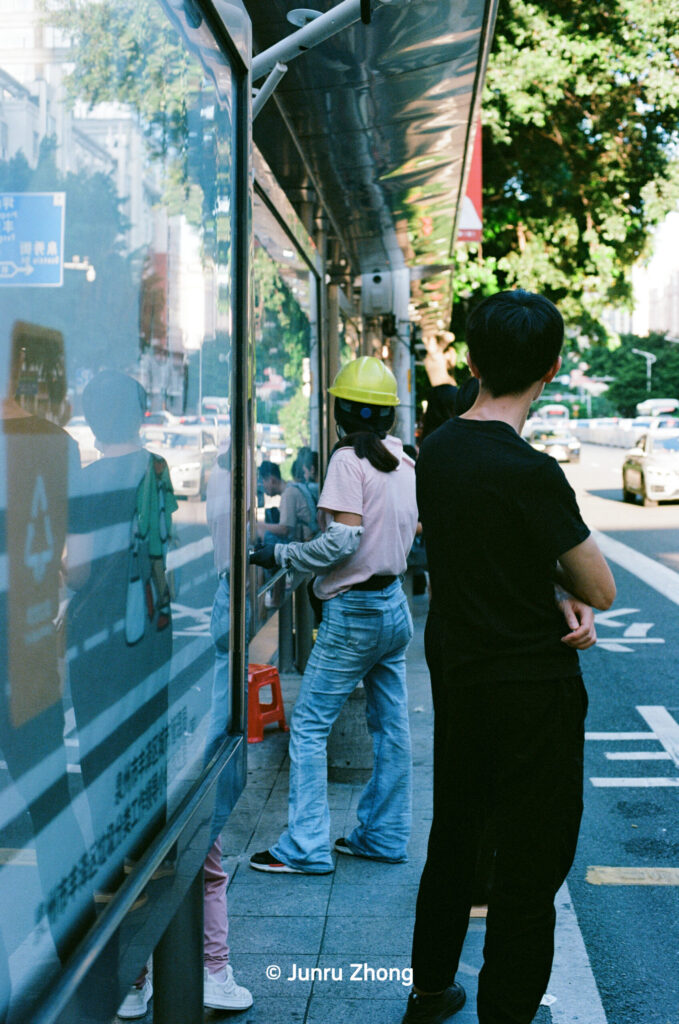
People
Kodak Professional ProImage 100Kodak Professional Ektar 100Kodak Professional ProImage 100
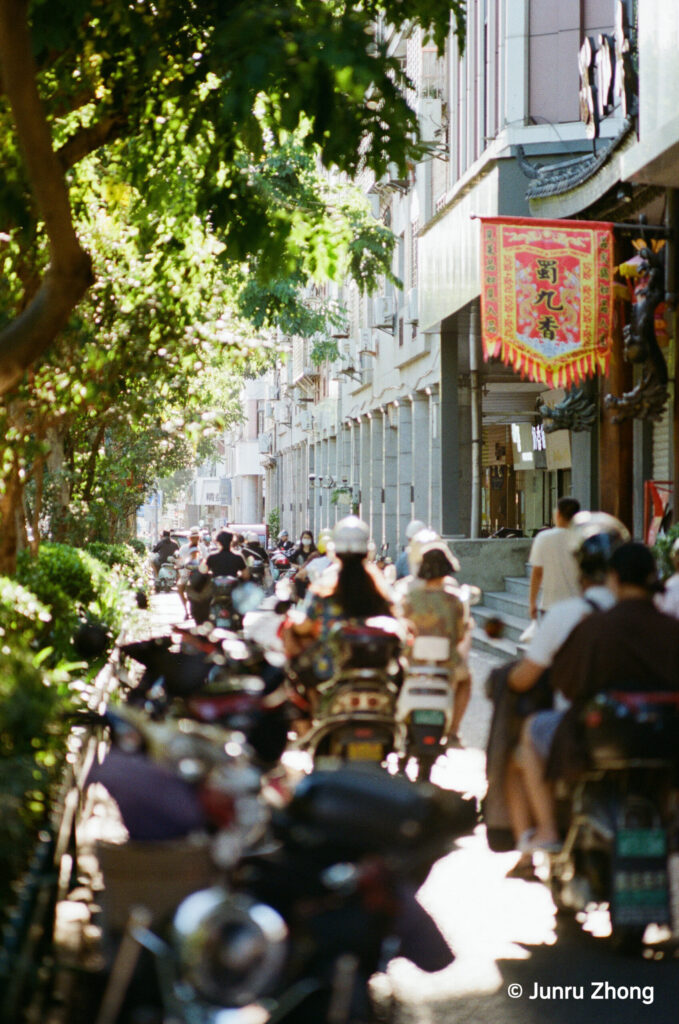
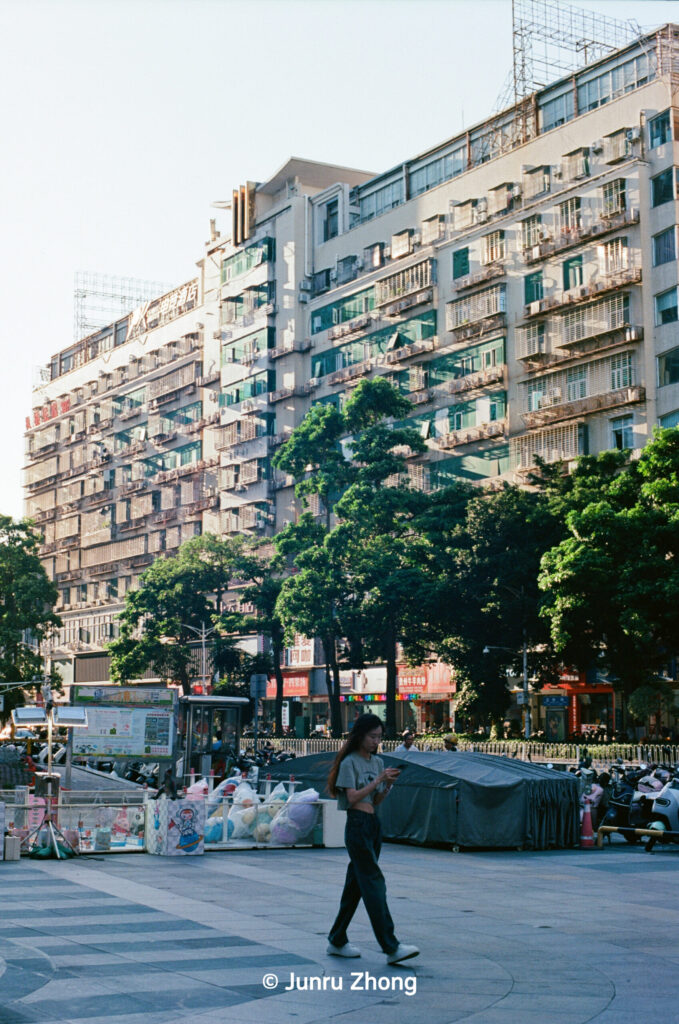
Urban
Kodak Professional ProImage 100Kodak Professional Ektar 100Kodak Professional ProImage 100Kodak Professional Ektar 100
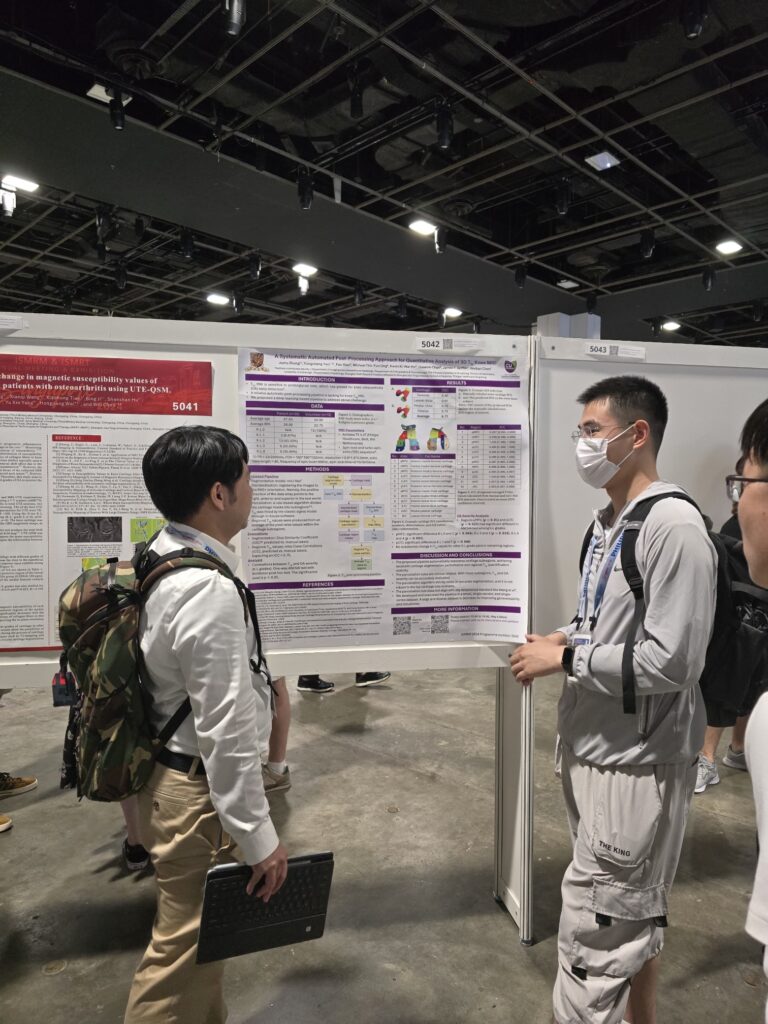
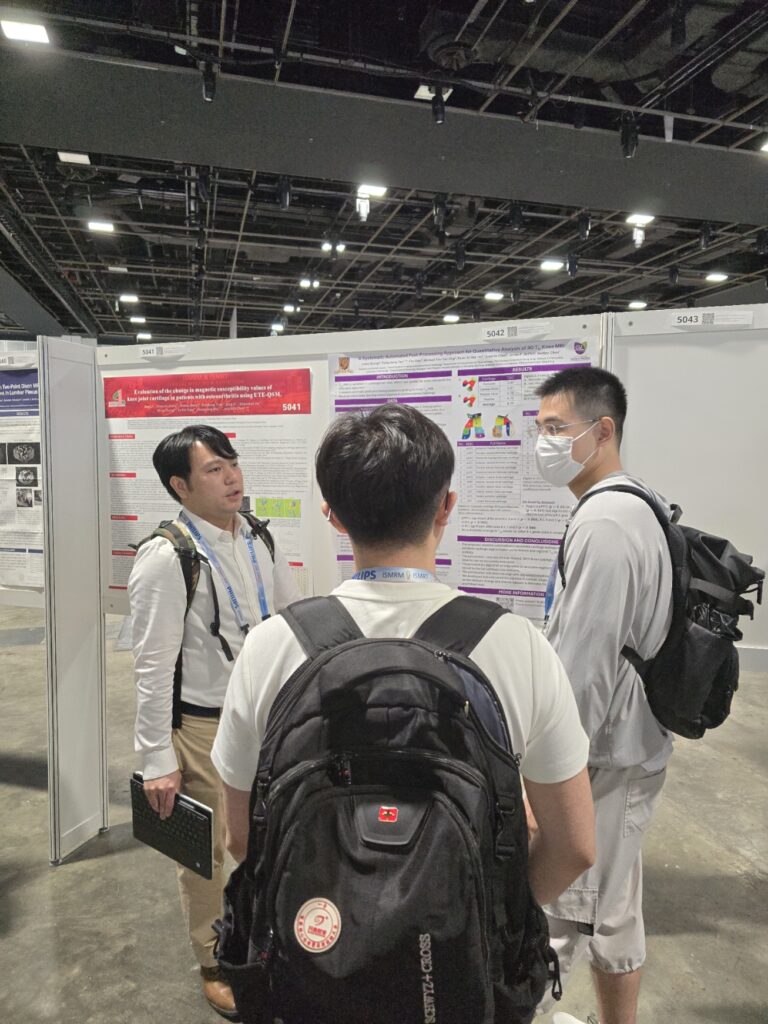
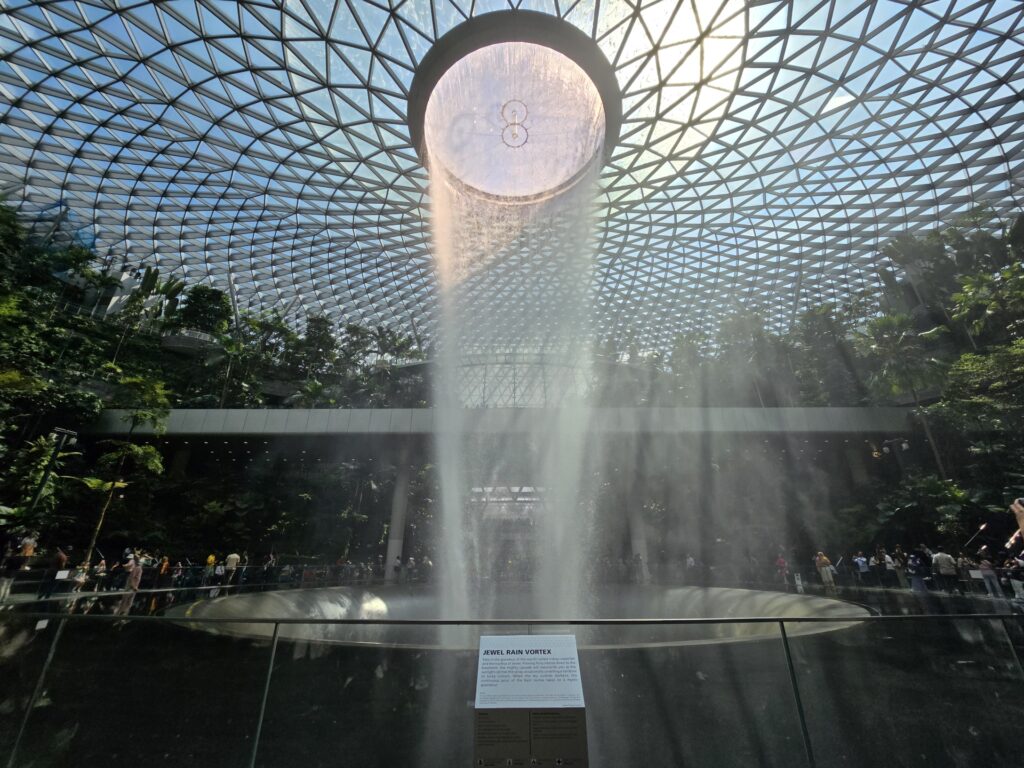
Growing up in southern China, Singapore has always been one of the most popular travel destinations. With the latest Sino-Singapore visa-exemption programme, Chinese MRI researchers like me can travel easily, unlike in Toronto last year. Or it will become worse in 2025?!
Interestingly enough, I was arranged to use a traditional poster section rather than a digital one, while most posters are digital in ISMRM. I almost have no visitors during my presentation section. To be fair, the traditional (paper) posters were hung during the entire conference period, while the digital posters were displayed only with the presenters.
This year, I presented a poster about automated post-processing of the T1ρ knee MRI. It was a simple project that applied nnU-Net to build segmentation masks on T1ρ knee MRI and used a modified version of the CartiMorph tool to generate subregions within the segmentation masks. Since my full paper has been rejected twice, I posted it to arXiv (https://arxiv.org/abs/2409.12600). Please check it out if you are interested in it.